The Region That Never Came Back: Asia-Pacific Is the Only Region Still Below 2019
 Elena DarziOctober 6, 202640 min read
In the first half of 2026, international tourist arrivals in Africa were 29 per cent above the same months of 2019. Europe was 11 per cent above. The Americas were 2 per cent above. Even the Middle East, where a conflict that began on 28 February closed airspace over several countries, was 7 per cent above. Asia and the Pacific was 11 per cent below. Seven years after the last normal year in global travel, it is the only region of the world that has not come back.
That single number is true, and it is misleading. Inside the region, Japan received 34 per cent more visitors in 2025 than in 2019 and Mongolia, on figures reported from its statistics office, 47 per cent more, while Thailand was 17 per cent short and Myanmar 78 per cent short. Recovery in Asia-Pacific is no longer a regional story. It is a set of national ones, and one of the clearest threads running through them is where travellers from mainland China chose to go, and where their government advised them not to go.
The short answer
Has tourism recovered to 2019 levels? Worldwide, yes. UN Tourism counts about 1.54 billion international arrivals in 2025, 4 per cent above 2019, and the first half of 2026 was also 4 per cent above the first half of 2019.
Which region has not? Asia and the Pacific. It was about 7 per cent below 2019 for 2025 as a whole on UN Tourism’s revised figures, and 11 per cent below in the first half of 2026.
Why? There is no single cause. The clearest one we can measure is mainland China: its outbound travel was still about 4 per cent below 2019 in 2025, and where those trips went shifted sharply three times in under two years, with immediate effects on Thailand, Japan and South Korea. For 2026, UN Tourism also points to disrupted air connectivity, higher airfares and uncertainty. Exchange rates, air capacity and national policy explain more of the gap in individual countries.
Where did Chinese travellers go? In three different directions in under two years: away from Thailand in early 2025, away from Japan after a government travel advisory in November 2025, and increasingly into South Korea, where Chinese arrivals in January to August 2026 were 23 per cent above the same months of 2019.
Who is filling the gap? Partly travellers from India, Taiwan and South Korea, who all made more trips abroad in 2025 than in 2019, and partly long-haul visitors from Europe, Australia and the United States. The traveller who has not come back is Japanese: Japan’s outbound departures were still 27 per cent below 2019 in 2025.
What about individual countries? Of 24 Asia-Pacific destinations with a comparable official series, 9 received more international visitors in 2025 than in 2019 and 15 received fewer. The middle of the range sits at 95 per cent of 2019.
The regional audit
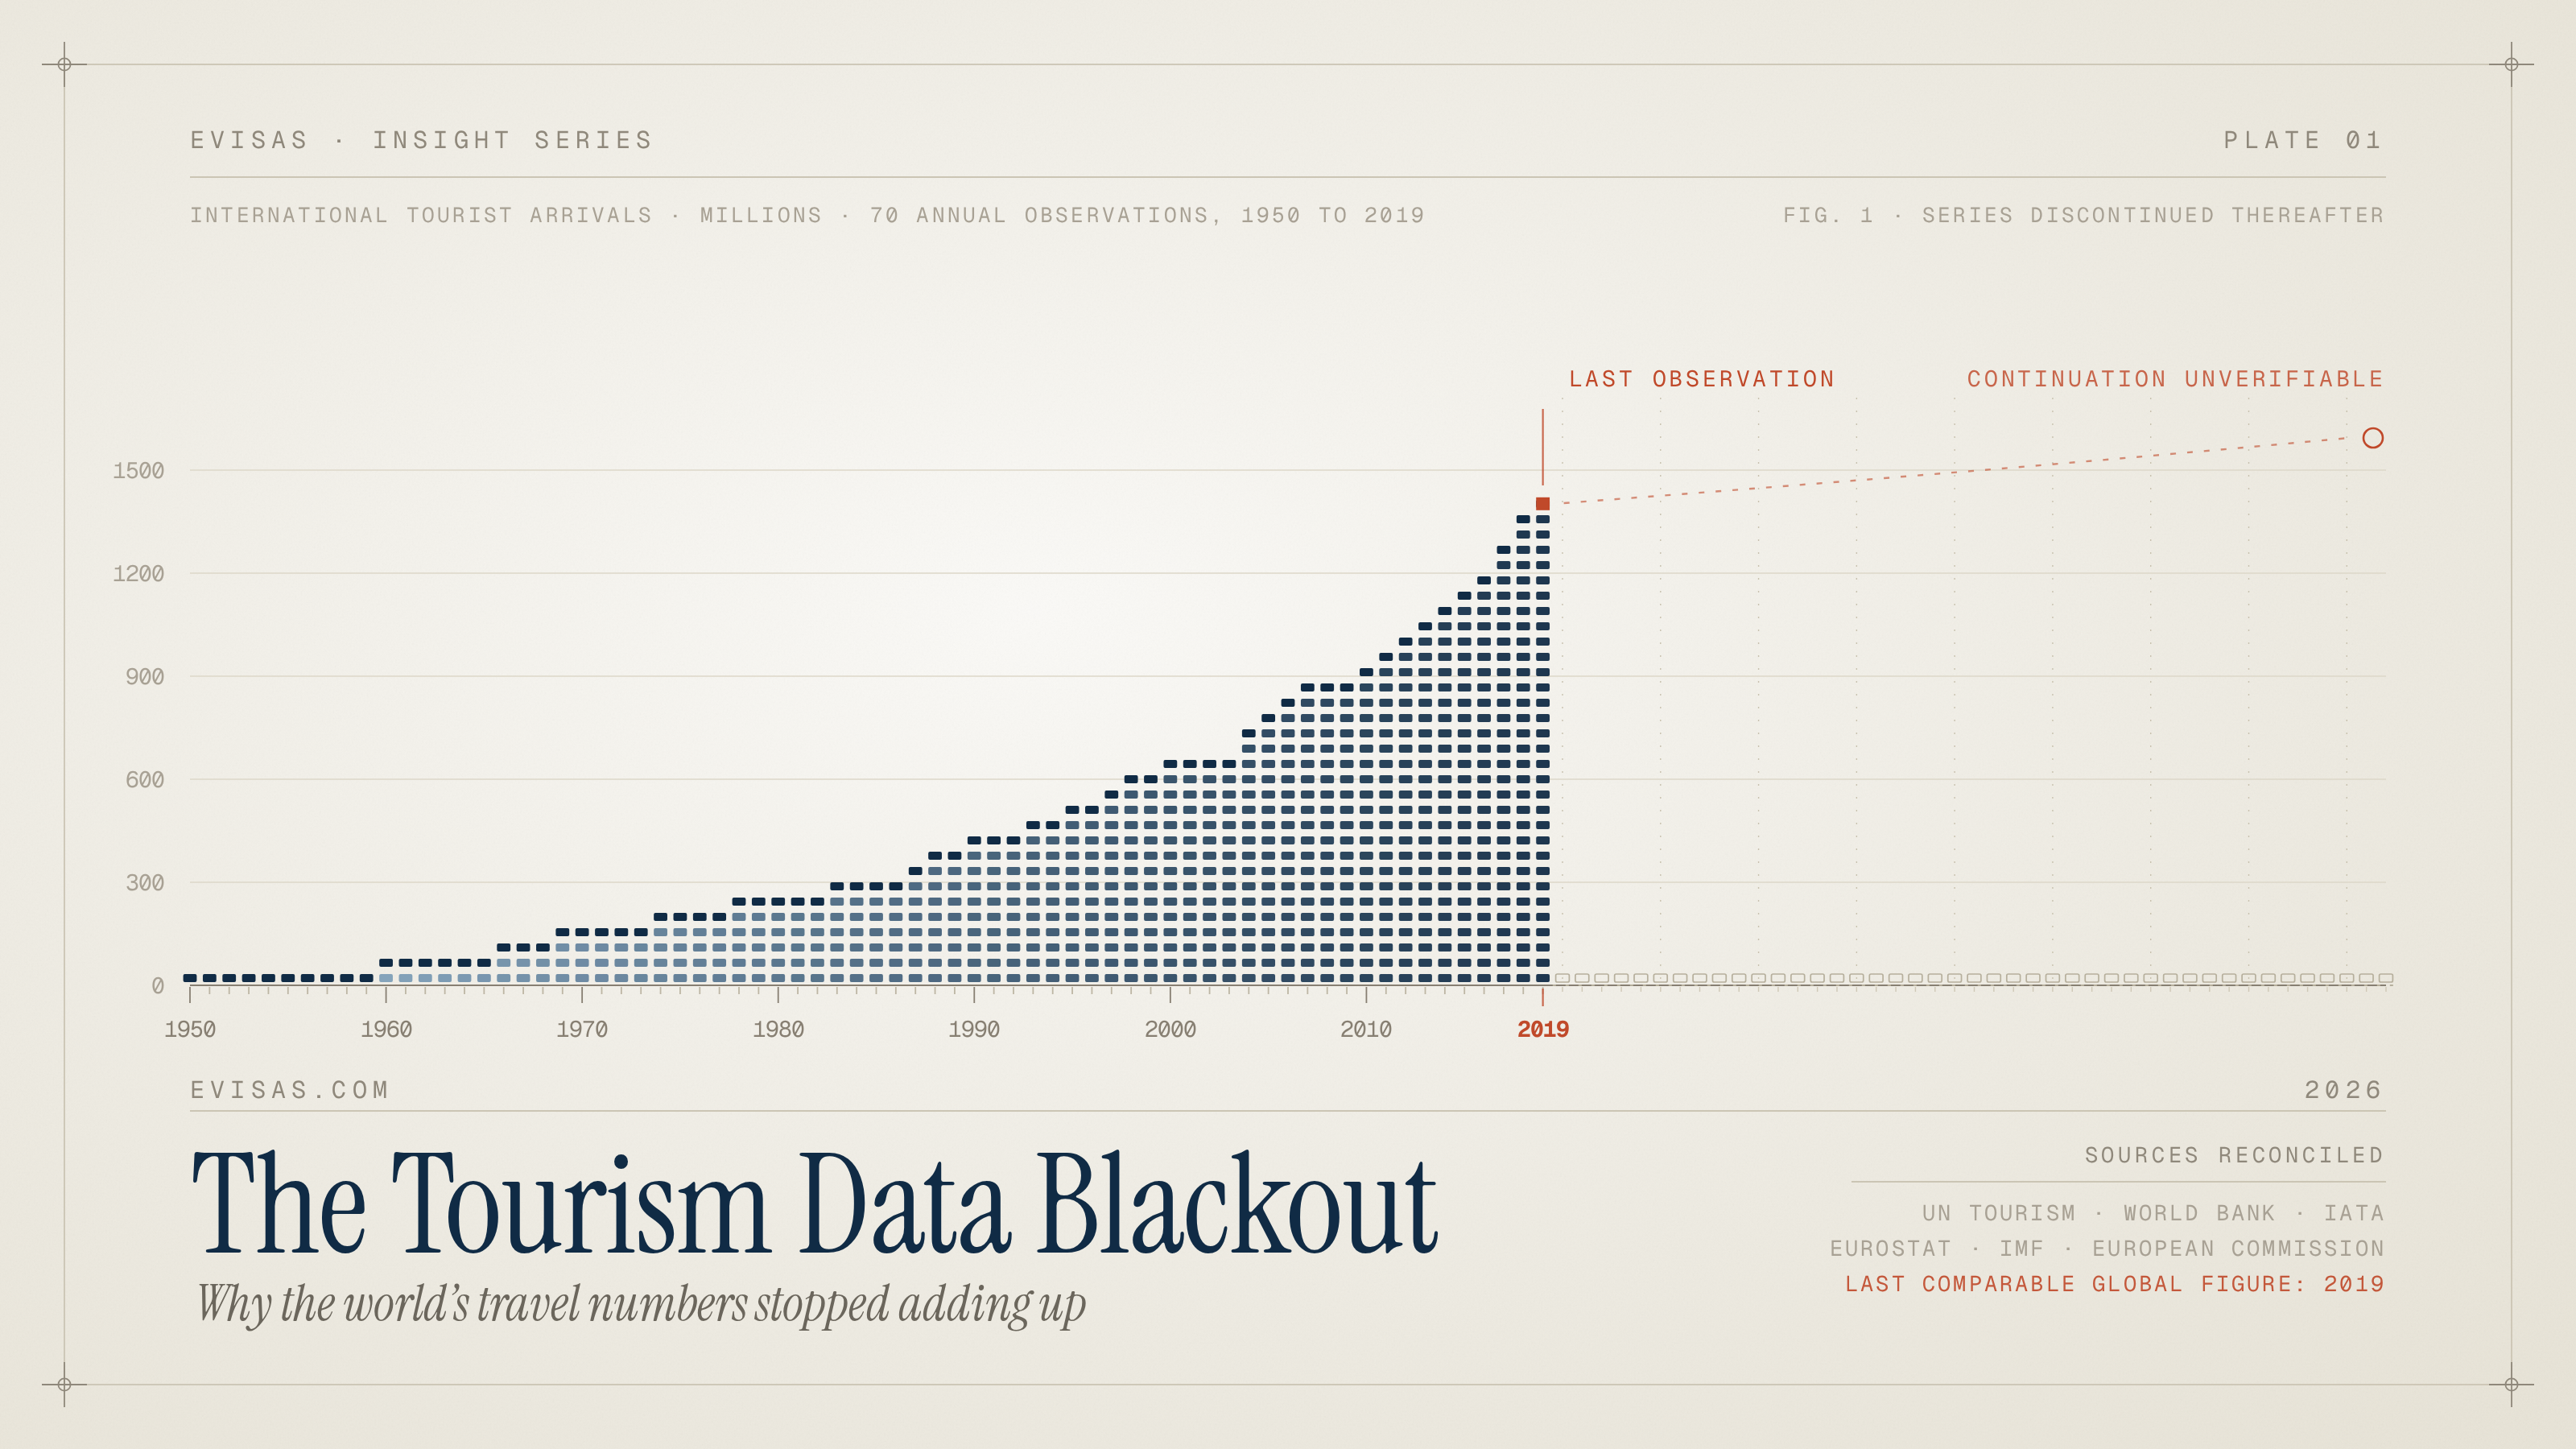
UN Tourism publishes its World Tourism Barometer several times a year. Its January 2026 edition gave the first full-year 2025 figures; its September 2026 edition revised them and added the first half of 2026. We use the September edition throughout, because it is the most recent. It is also one of the few global tourism series still published on a current basis; why so many others stopped in 2019 is the subject of The Tourism Data Blackout.
Table 1. International tourist arrivals by region, 2025 and first half of 2026, against 2019
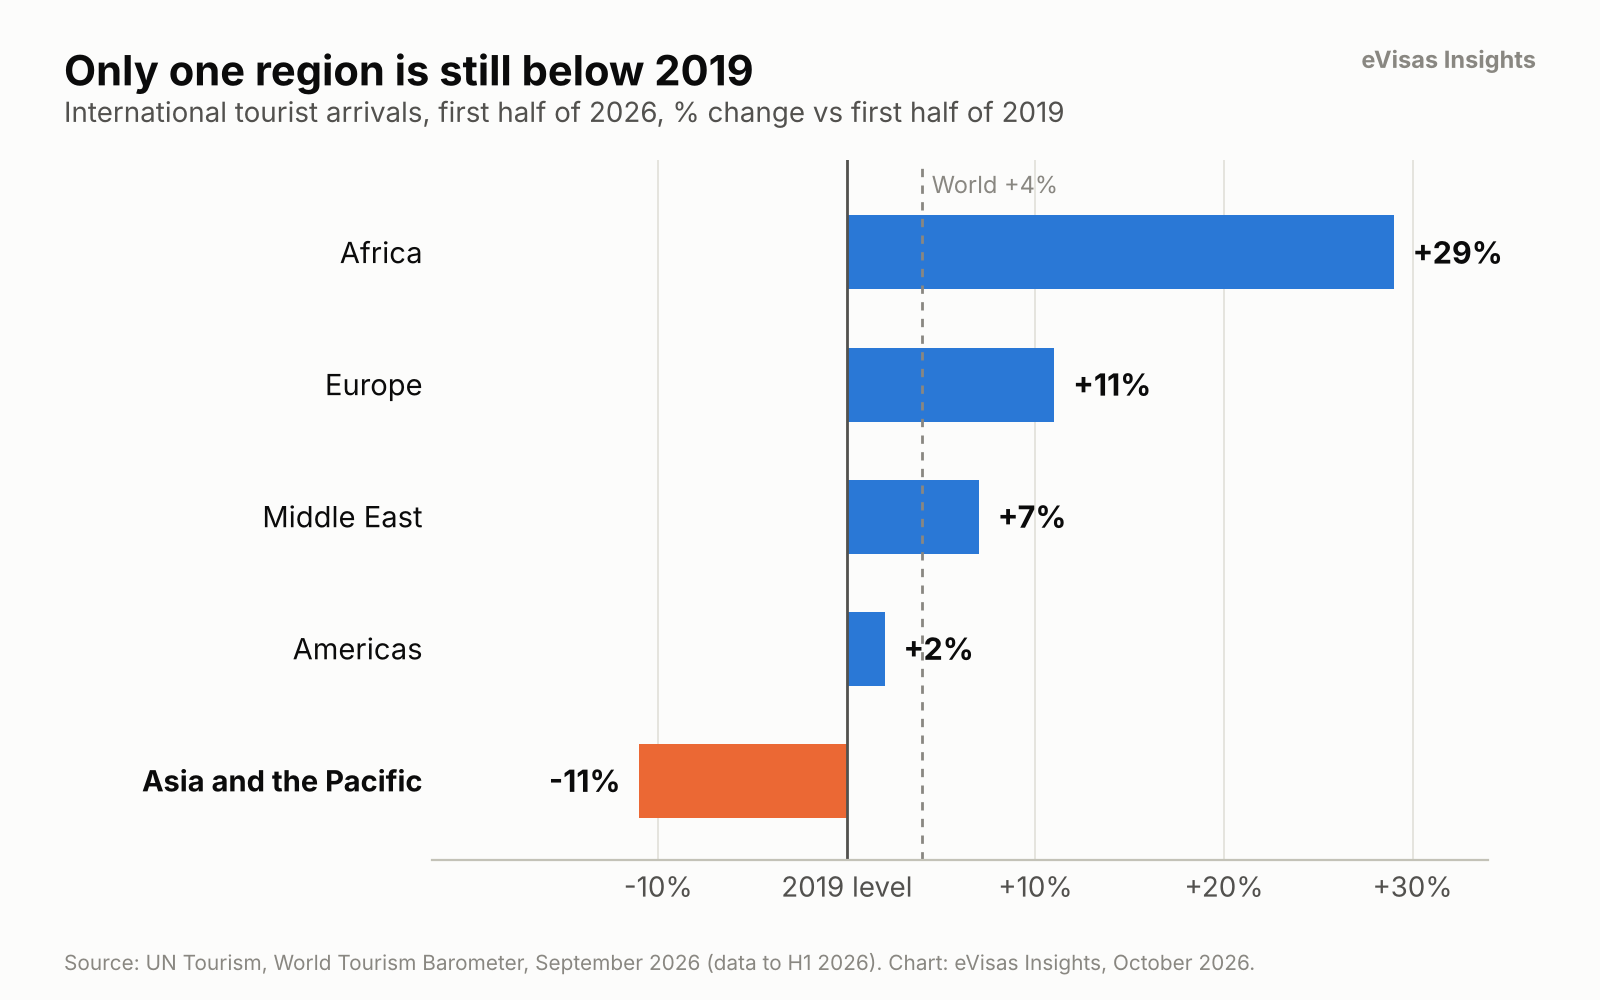
Chart 1. International tourist arrivals, first half of 2026, change against the first half of 2019. Source: UN Tourism, World Tourism Barometer, September 2026.
Two things in this table deserve a second look.
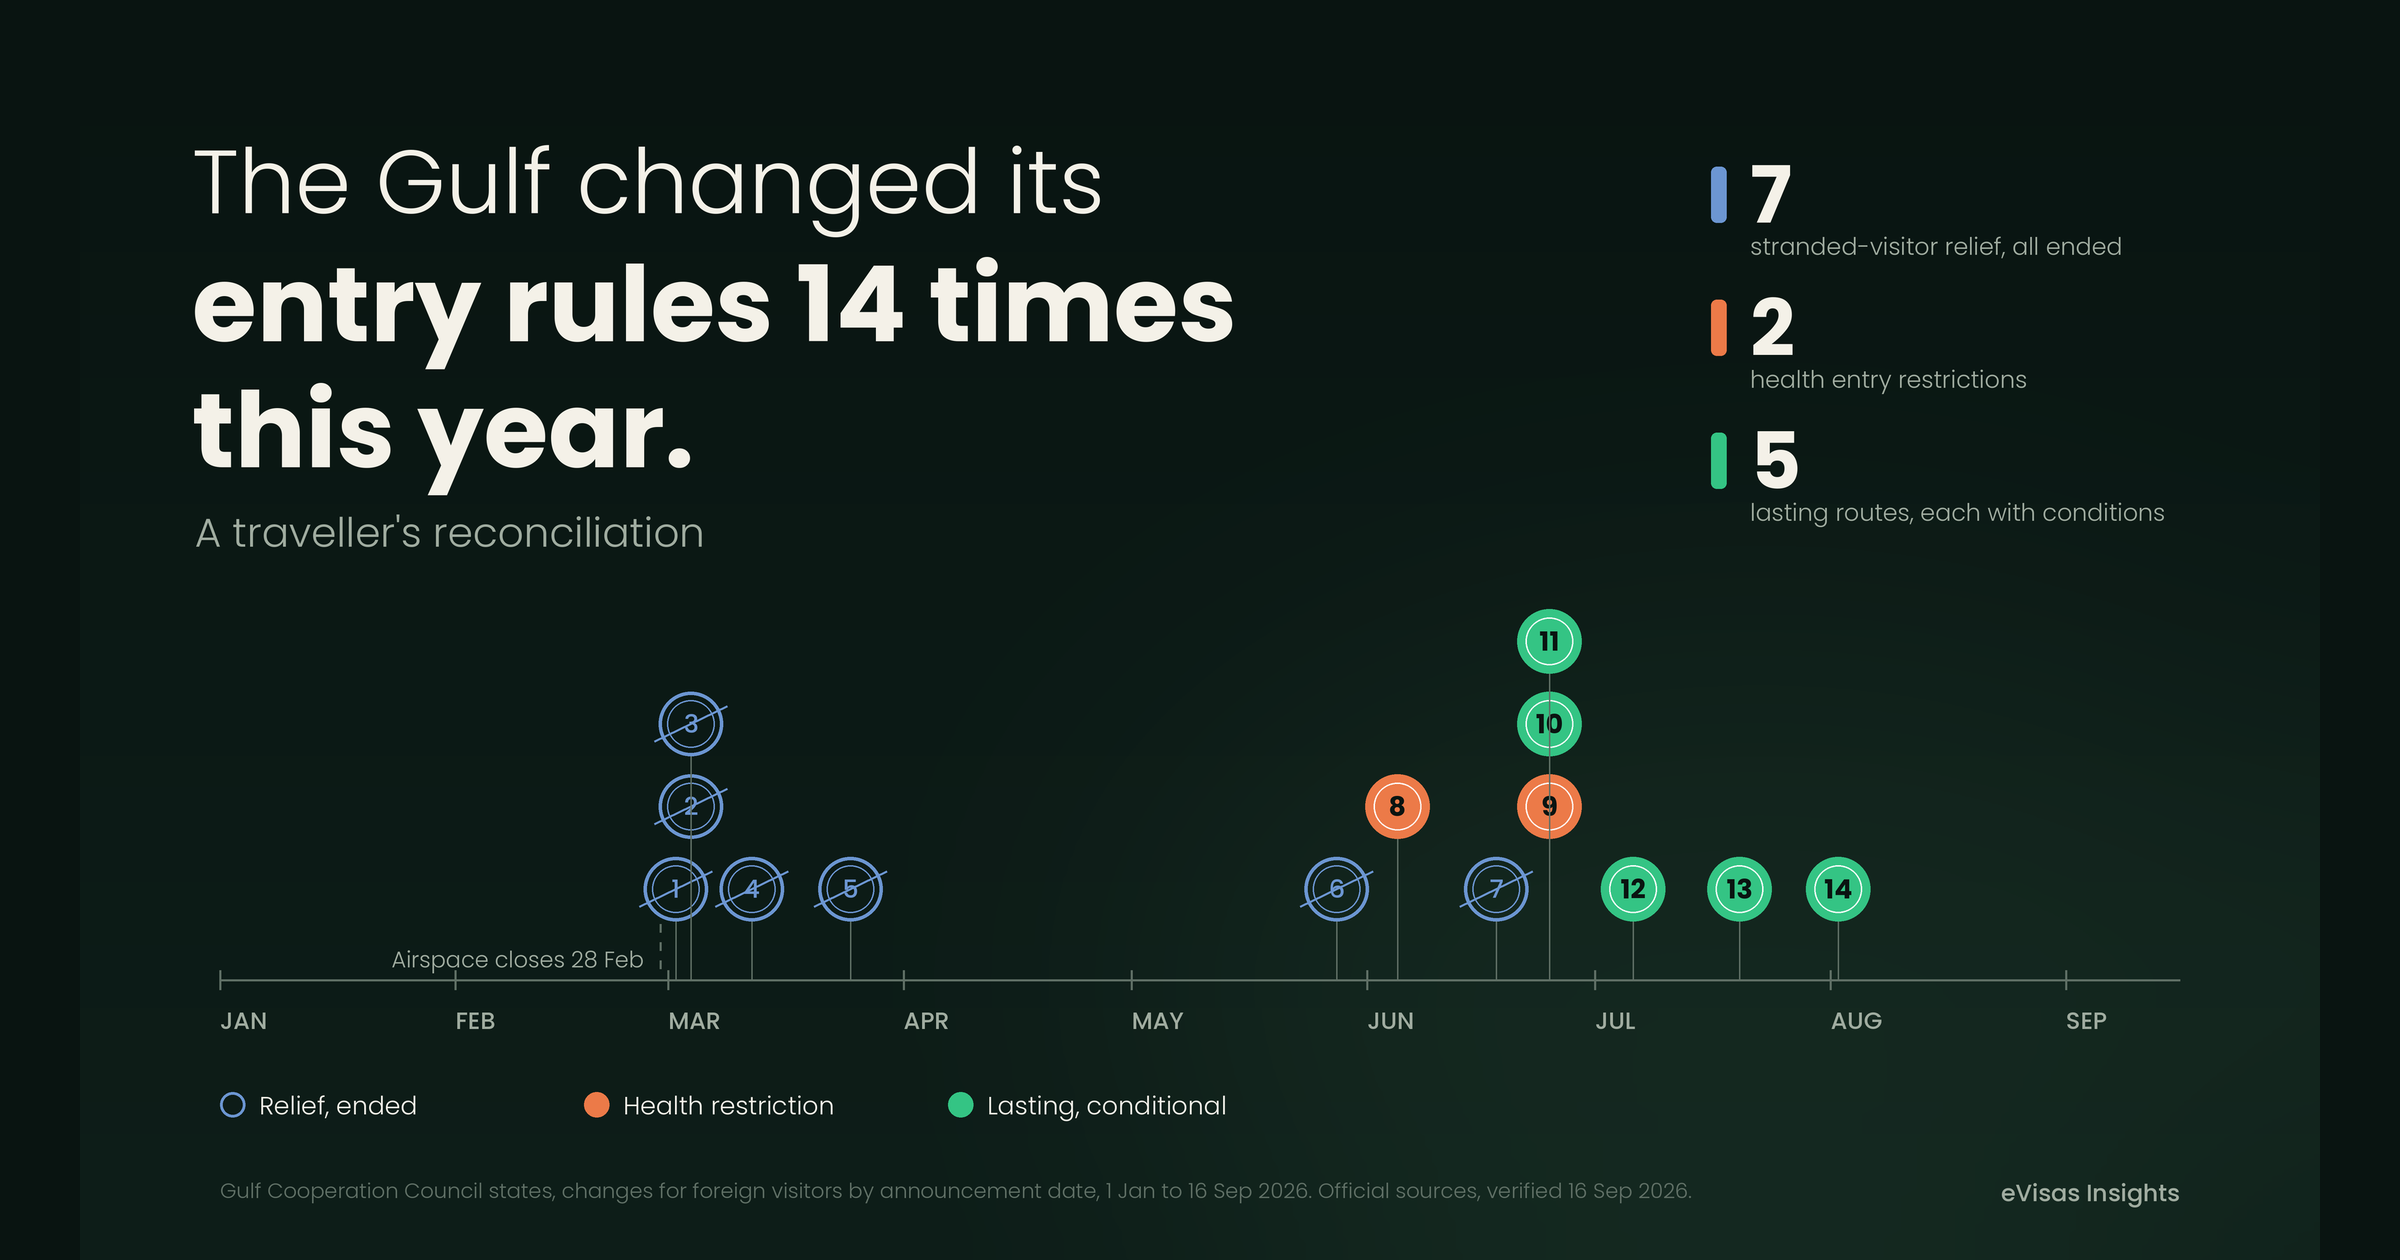
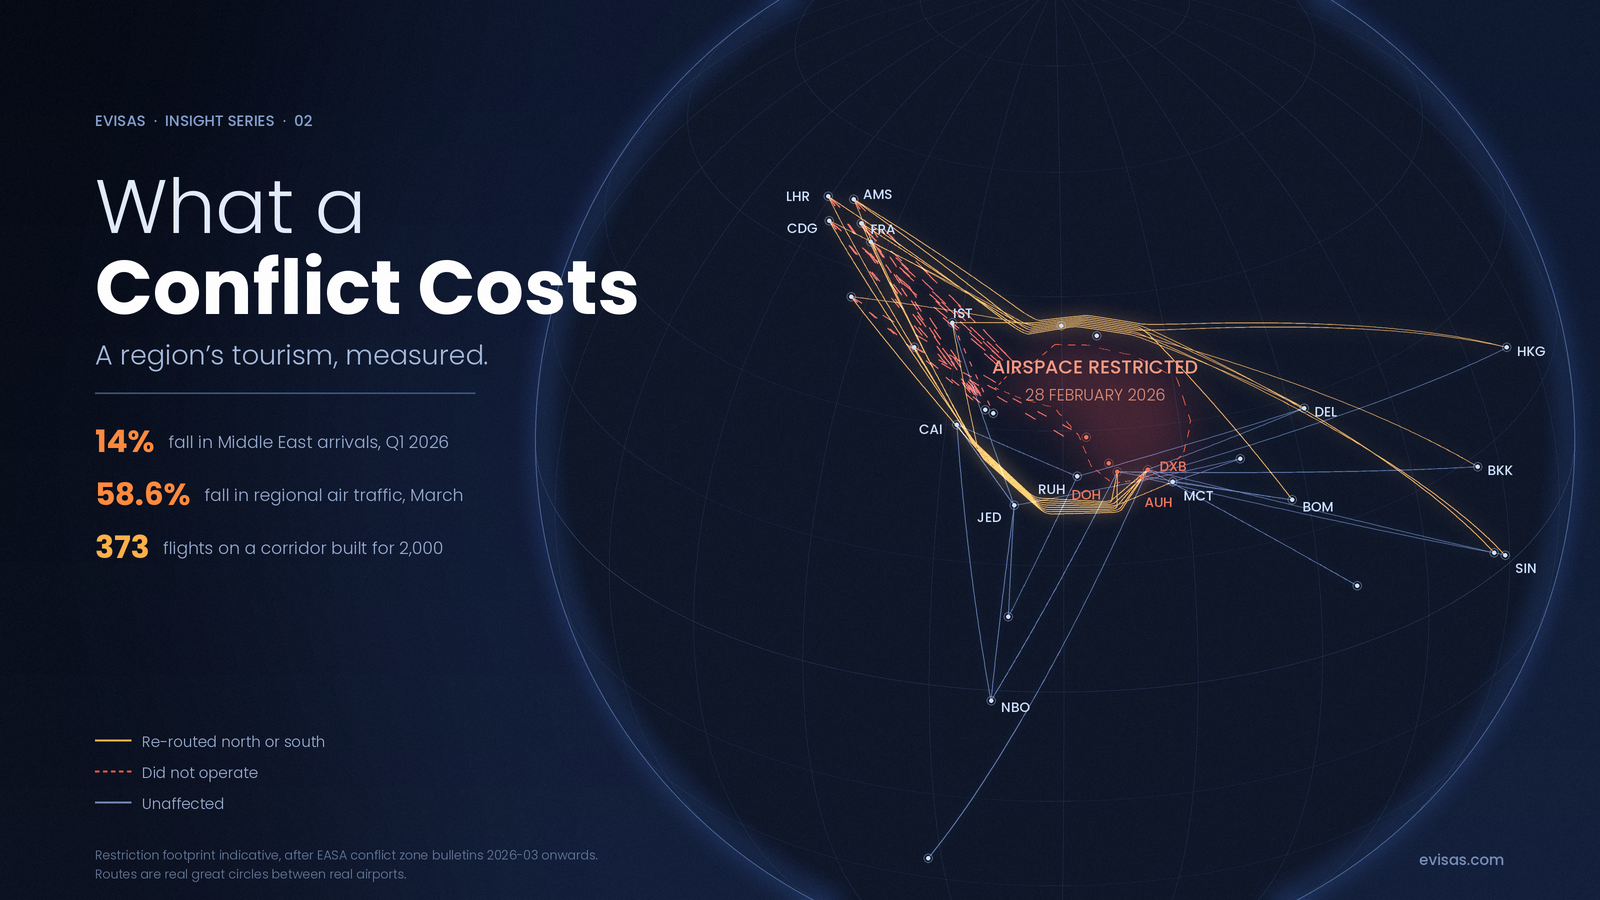
The Middle East is still above 2019, despite falling by a fifth this year. The region grew so strongly between 2019 and 2025 that a 22 per cent fall in the first half of 2026 still leaves it above its 2019 level. We measured that shock in detail in What a Conflict Costs a Region’s Tourism, Measured. How the Gulf states changed their entry rules through the same months is reconciled in The Gulf Changed Its Entry Rules 14 Times This Year. Asia-Pacific is the opposite case: no shock of that size, and still below.
The 2025 gap has been narrowed by revision. UN Tourism’s January estimate put Asia and the Pacific 9 per cent below 2019 for the year. The September revision raised the region’s 2025 total from 330.7 million to 336.6 million, which narrows the gap to about 7 per cent on our calculation. The direction of the finding does not change; its size does, and anyone quoting the January figure should know it has moved.
Table 2. Asia-Pacific subregions, 2025 against 2019
Source: calculated by eVisas from UN Tourism, World Tourism Barometer, September 2026. UN Tourism does not publish subregion comparisons with 2019.
South Asia, which UN Tourism says recovered its pre-pandemic level in 2025, is the only subregion back above the line. The other three are below. But subregions are averages too, and the next layer down is where the real story sits.
The average hides a league table
Most coverage stops at the regional average. We built a country-by-country table instead, measuring each destination against its own 2019 figure, from 27 national official series: tourism ministries, statistics offices and immigration authorities. For each destination we used the measure closest to “international visitors staying at least one night” that the country publishes, and we flag every definition that differs. The full dataset is published with this article.
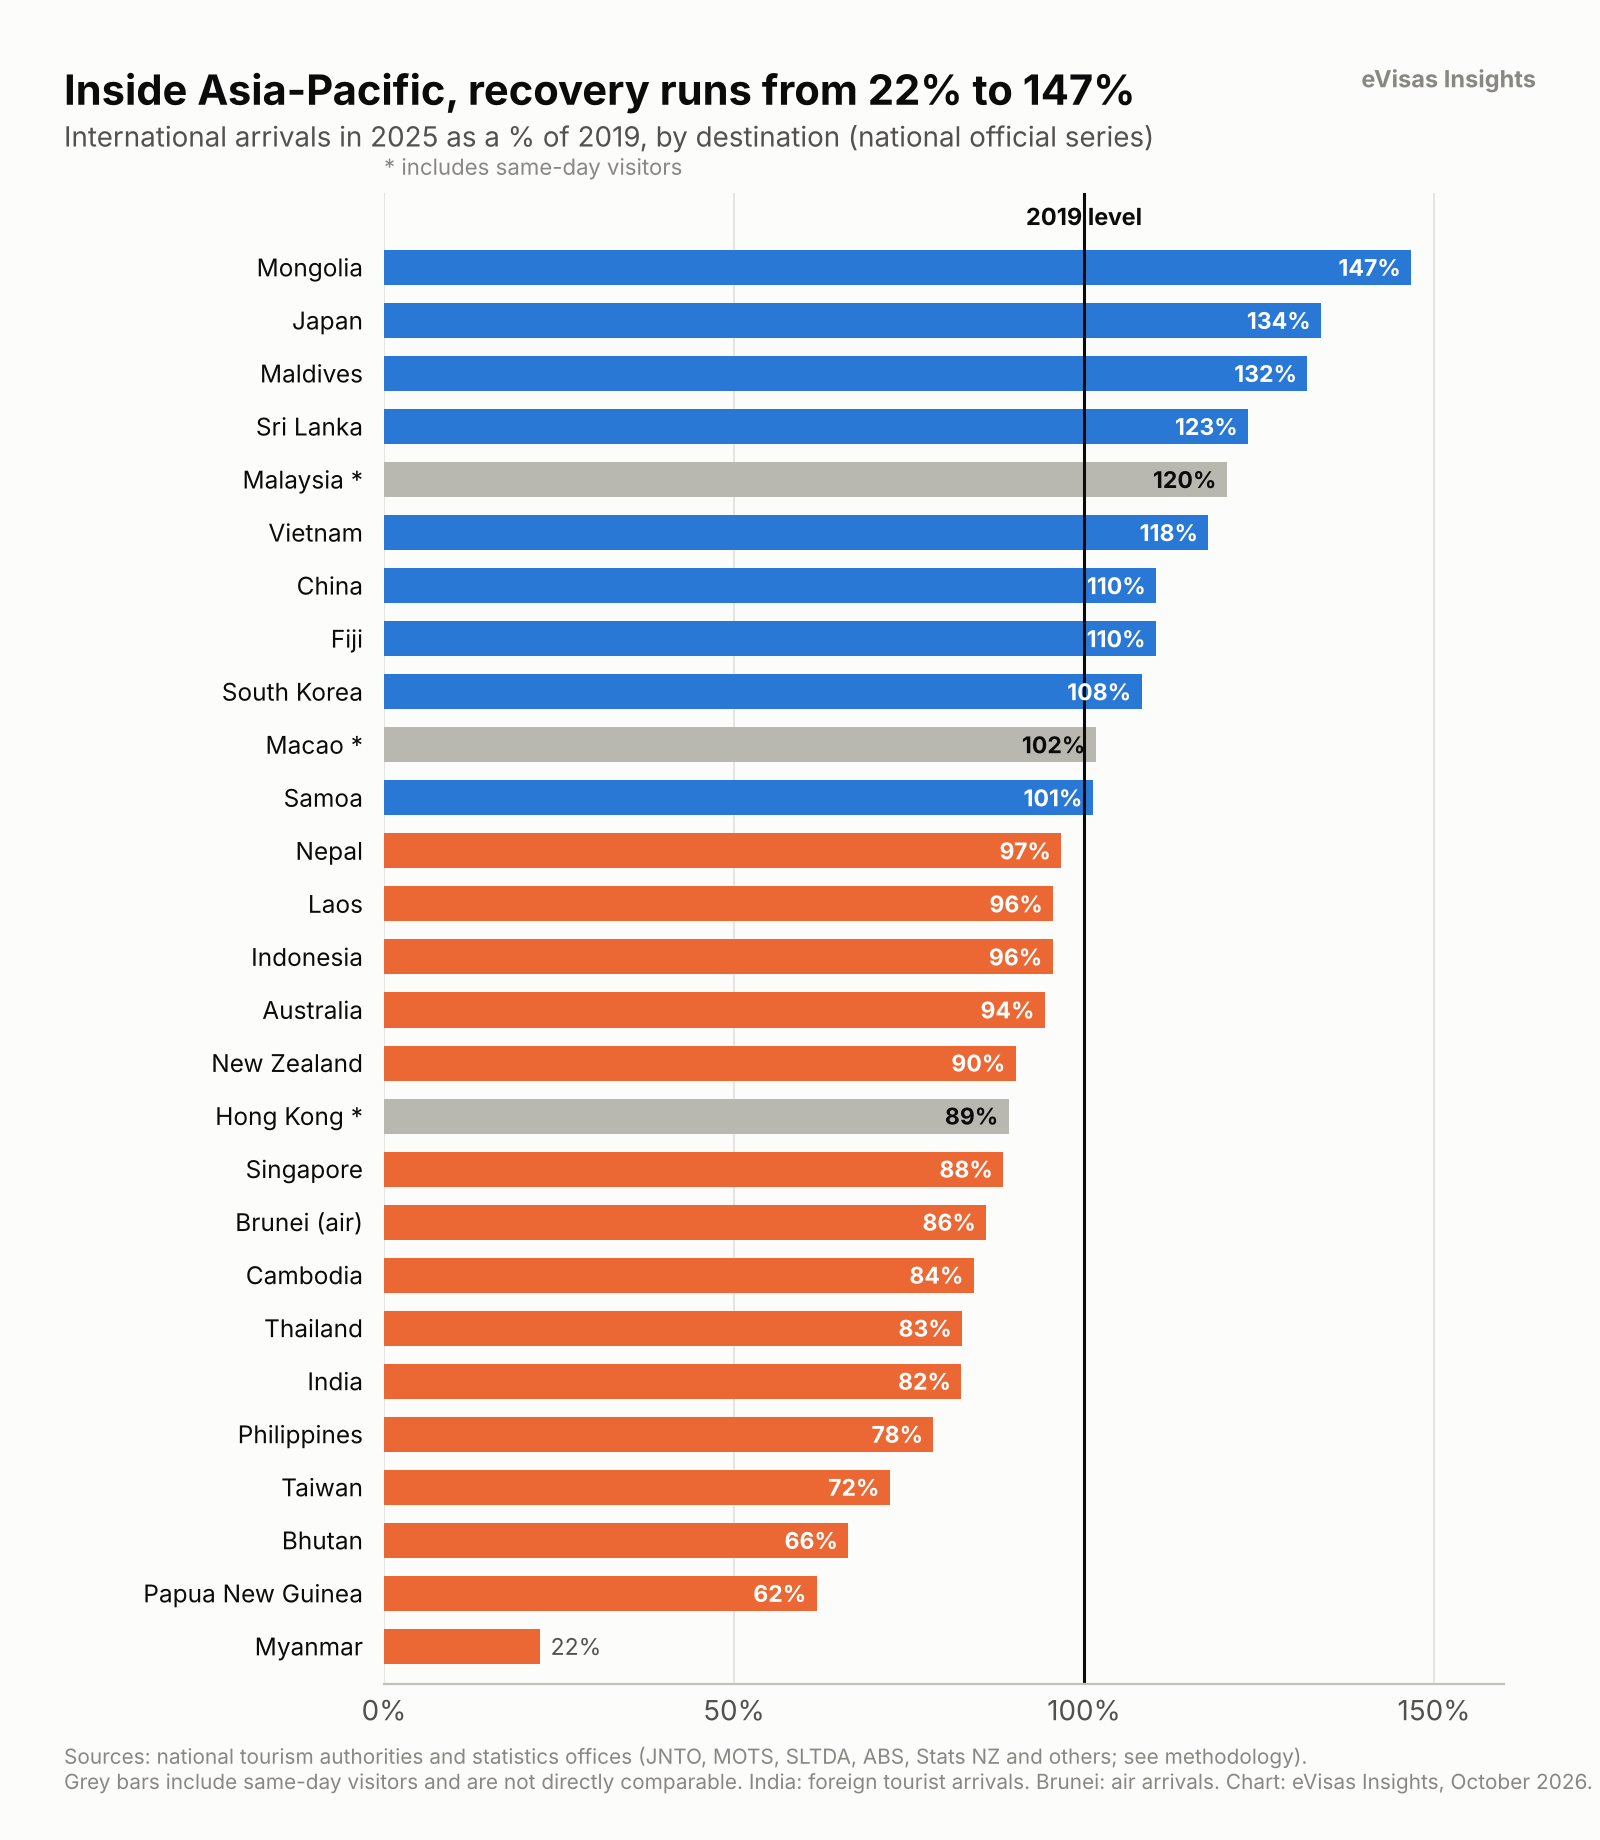
Chart 2. International arrivals in 2025 as a percentage of 2019, by destination. Grey bars include same-day visitors and are shown for reference only. Sources: national tourism authorities and statistics offices, listed in the methodology.
Table 3. Asia-Pacific recovery league table, 2025 against 2019
Sources: listed by country in the methodology. Primary means read on the publisher’s own page or file; secondary means the official figure was available to us only through a news agency or newspaper quoting it.
Read down the table and three things stand out.
The spread is enormous. The best-performing destination ended 2025 at nearly one and a half times its 2019 level; the weakest at under a quarter. A regional average of minus 7 per cent describes almost none of them. Only six of the 24 sit within five points of it.
More destinations are below than above, but not by much. Fifteen of the 24 comparable destinations were below 2019 in 2025, and nine above. The median destination was at 95 per cent of 2019. A typical Asia-Pacific country, in other words, is close to recovered, and the largest shortfalls are concentrated in a few places.
A few countries carry most of the movement. Added together, the nine destinations above 2019 gained about 20 million arrivals on 2019. The fifteen below lost about 23 million. Japan alone gained 10.8 million, more than Thailand (minus 6.9 million) and Taiwan (minus 3.3 million) lost between them. Myanmar, at minus 3.4 million, is the second-largest single shortfall. These national series use different definitions from UN Tourism’s and leave out some destinations, including Hong Kong, so they cannot be added up to the regional total; the table shows where gains and losses are concentrated, not a reconciliation of the region’s figure.
The Chinese traveller moved, three times
Mainland China is one of the region’s largest source markets, and it has not fully returned. China’s Ministry of Culture and Tourism recorded 148.4 million outbound tourist trips in 2025, against 154.6 million in 2019: about 96 per cent, though the ministry words the measure slightly differently in the two years. The National Immigration Administration’s count of mainland residents crossing the border tells the same story, at 335 million crossings in 2025 against 350 million in 2019. China does not publish a destination breakdown we could use to see how that shortfall is distributed.
The more important change is not how many Chinese travellers there are, but where they went. In under two years the flow moved three times. One more number is worth keeping in mind: China’s foreign exchange regulator, SAFE, recorded spending on travel abroad in 2025 at 99.8 per cent of its 2019 level in nominal US dollars. That measure covers all purposes, including study and medical travel, and is not broken down by destination, but it suggests the spending power of Chinese travellers has returned even where the trips have not.
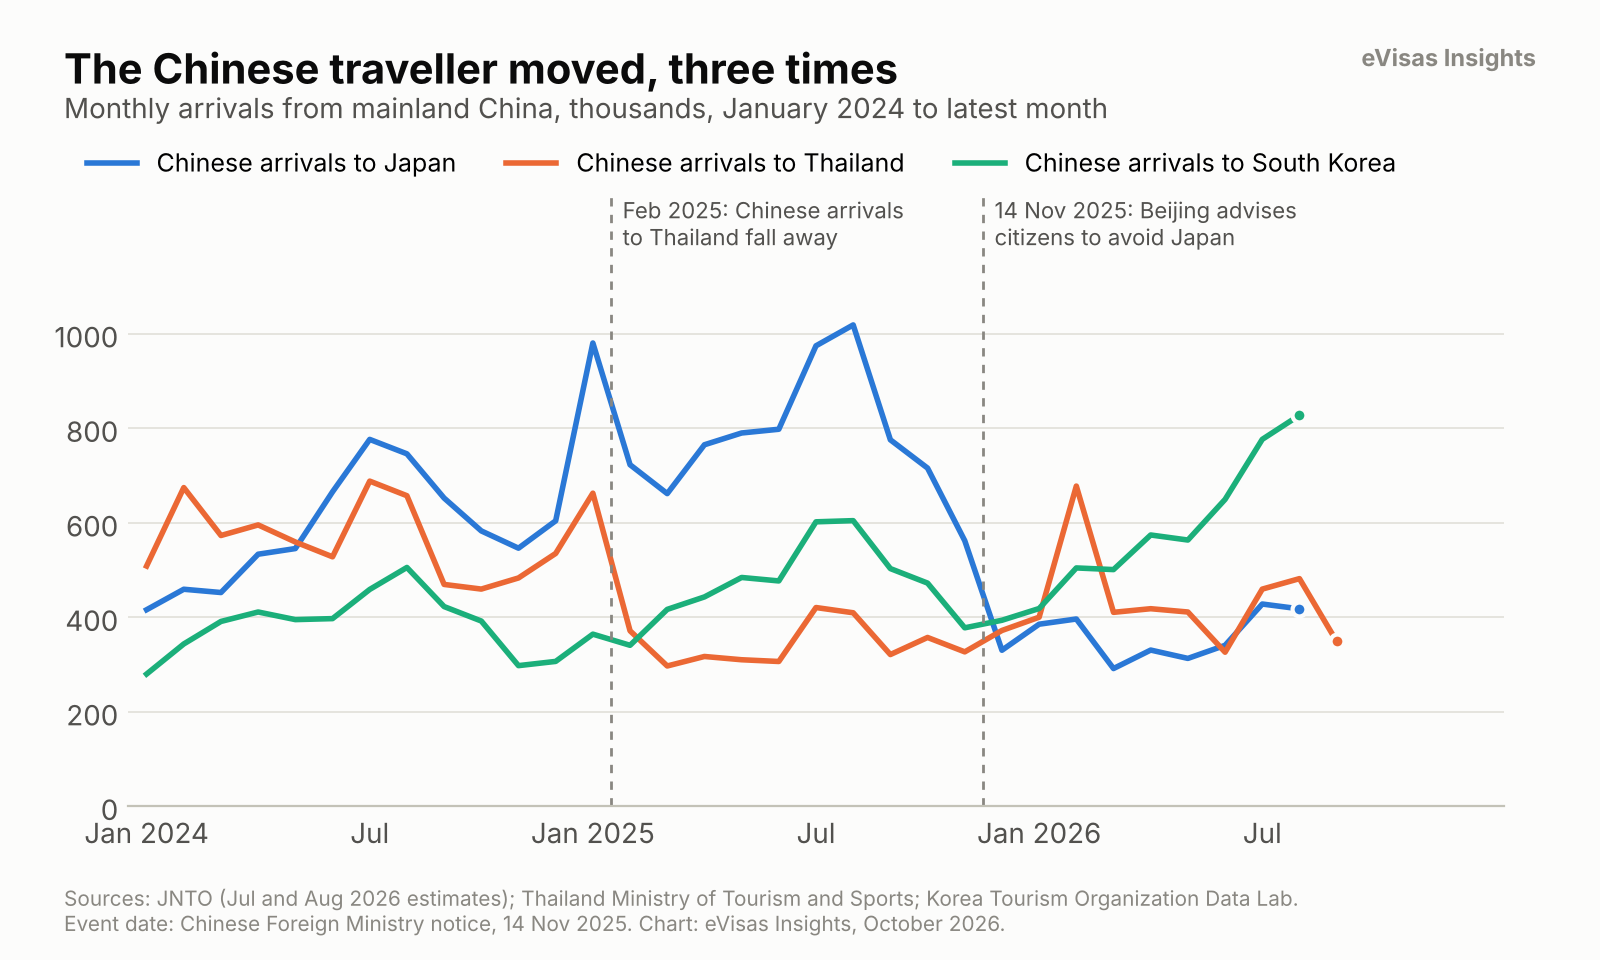
Chart 3. Monthly arrivals from mainland China to Japan, Thailand and South Korea, January 2024 to the latest month published. Sources: JNTO (July and August 2026 are JNTO estimates); Thailand Ministry of Tourism and Sports; Korea Tourism Organization Data Lab.
The first move: away from Thailand, early 2025. Chinese arrivals to Thailand fell by 45 per cent year on year in February 2025 and stayed between 22 and 48 per cent down for every remaining month of the year. For 2025 as a whole Thailand received 4,473,992 Chinese visitors, against 6,733,162 in 2024, a fall of 34 per cent. That loss of 2.26 million visitors accounts for about 88 per cent of Thailand’s total fall in international arrivals that year. The Bank of Thailand’s Monetary Policy Report for the second quarter of 2025 pointed to safety concerns, forecasting that Chinese tourist numbers “would recover slowly despite the government implementing measures to improve Thailand’s image as safety concerns typically take time before tourism confidence improves.” The timing matches widely reported coverage in January 2025 of a Chinese actor taken across the Myanmar border to a scam compound, though no official source we found links the two directly. In 2025, Malaysia overtook China as Thailand’s largest source market.
Where Chinese travellers went instead, in 2025. The same Bank of Thailand report noted that Chinese travel to Japan and Vietnam “surged by 78%” in the first quarter of 2025. Japan received 9,095,931 visitors from mainland China in 2025, up 30 per cent on 2024. Chinese outbound travel as a whole also grew by about a fifth in 2025, so not all of Japan’s gain was Thailand’s loss.
The second move: away from Japan, late 2025. On 14 November 2025, China’s Ministry of Foreign Affairs and its missions in Japan advised Chinese citizens to avoid travelling to Japan in the near term, according to the notice as reproduced by People’s Daily. JNTO’s figures show the effect immediately (its July and August 2026 figures are estimates). Chinese arrivals fell 45 per cent year on year in December 2025, and in every month from March to August 2026 they were down between 56 and 60 per cent. Over January to August 2026, Japan received 2.9 million Chinese visitors against 6.7 million in the same months of 2025: 3.8 million fewer in eight months. JNTO’s own monthly commentary attributes the fall to the government advisory and to reduced flights.
The third move: into South Korea. South Korea’s Chinese arrivals were already rising by 20 to 31 per cent a month from May 2025, and the advisory against Japan accelerated the trend. Over January to August 2026, South Korea received 4,816,134 visitors from mainland China, 29 per cent more than a year earlier and 23 per cent more than in the same months of 2019, according to the Korea Tourism Organization. August 2026 brought 827,704 Chinese arrivals and 2,245,293 foreign visitors in total, both the highest monthly figures in the organisation’s series since at least 2019. Chinese arrivals to Thailand also turned up, rising 16 per cent in January to August 2026, though they remain far below 2024.
Not every lost visitor reappeared nearby. Japan received 3.8 million fewer Chinese visitors in January to August 2026 than a year earlier. Over the same eight months, South Korea received 1.1 million more and Thailand about 0.5 million more, while Vietnam’s Chinese arrivals were flat. Even if every one of those extra visitors had been diverted from Japan, which the data cannot show, they would account for less than half of Japan’s loss.
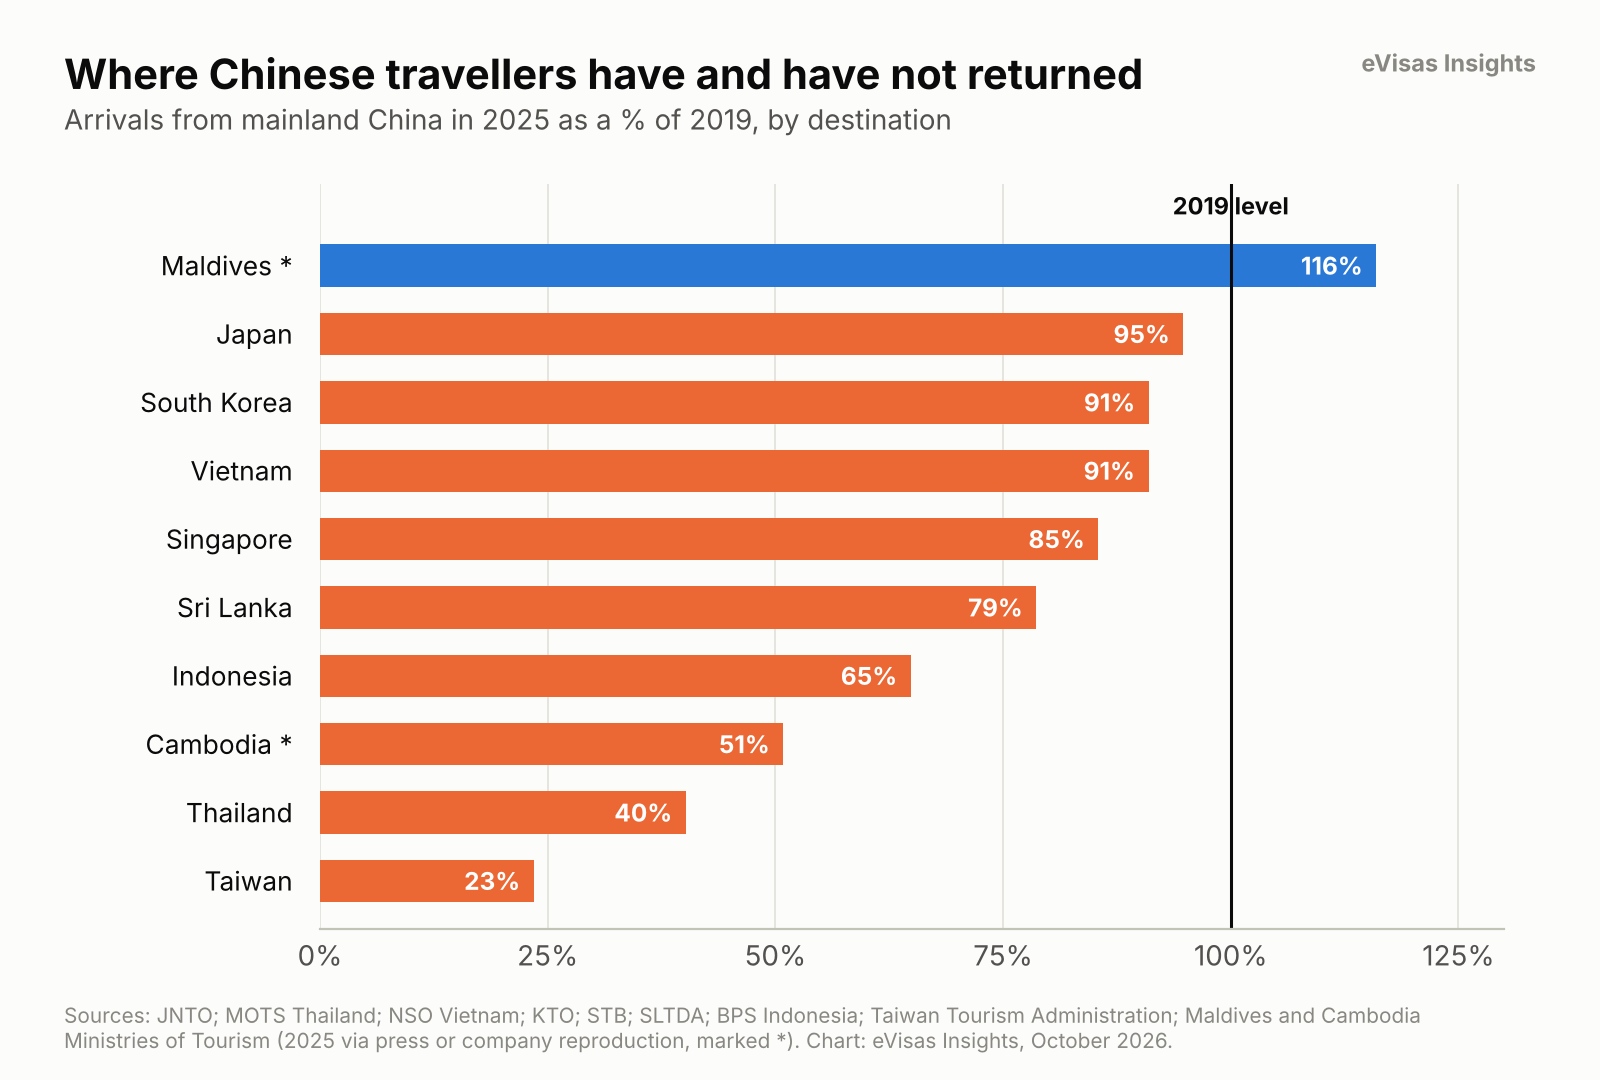
Chart 4. Arrivals from mainland China in 2025 as a percentage of 2019, by destination. Figures marked with an asterisk rely on official numbers reported by the press. Sources: national tourism authorities and statistics offices, listed in the methodology.
Measured against 2019, Chinese travellers had returned almost nowhere in 2025. Of ten destinations where we could compare official counts of mainland Chinese arrivals, only the Maldives received more in 2025 than in 2019, by 16 per cent, on Ministry of Tourism figures reported by the local press. Japan was at 95 per cent, South Korea and Vietnam at 91, Singapore at 85, Sri Lanka at 79, Indonesia at 65 and Cambodia at about half. Thailand received 40 per cent of its 2019 Chinese total, on the Ministry of Tourism and Sports’ own figures. Taiwan received 23 per cent. In 2026, South Korea has moved above its 2019 level.
The lesson for anyone reading tourism statistics is that a destination’s recovery in this region can now turn on decisions and perceptions that change in a single month: a safety story, a diplomatic dispute, a government notice. Taiwan is the clearest structural example. Arrivals from mainland China fell from 2,714,065 in 2019 to 637,060 in 2025, which accounts for about 63 per cent of Taiwan’s total shortfall. Excluding mainland visitors, Taiwan was at 87 per cent of 2019 rather than 72 per cent.
The travellers filling the gap
If Chinese travellers are not back, who is? Partly the region’s other big source markets, which have recovered faster than China’s and much faster than Japan’s, and partly long-haul visitors. Together they explain how many destinations have recovered without their 2019 Chinese numbers, though not all of the gap: the 2025 increase in trips abroad from India, Taiwan and South Korea, about 8.5 million, is smaller than the roughly 11.6 million trips still missing from China and Japan.
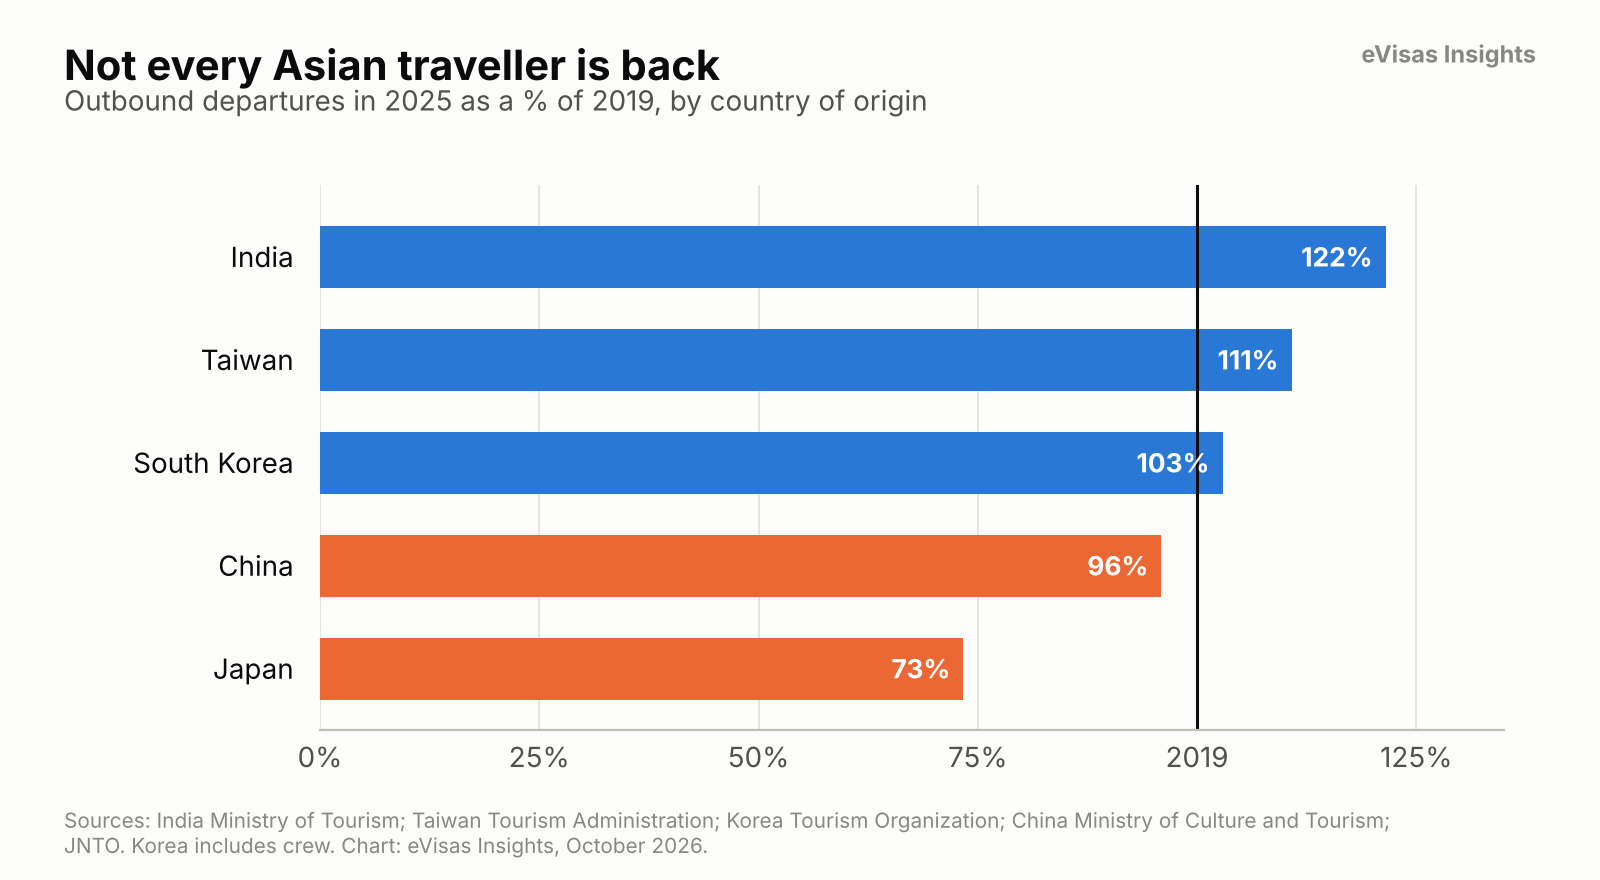
Chart 5. Outbound departures in 2025 as a percentage of 2019, by country of origin. Sources: India Ministry of Tourism; Taiwan Tourism Administration; Korea Tourism Organization; China Ministry of Culture and Tourism; JNTO.
Indians are travelling much more than in 2019. India’s Ministry of Tourism counted 32.7 million departures by Indian nationals in 2025 on provisional figures, 22 per cent more than in 2019. The effect shows up across the region. Vietnam received 746,480 visitors from India in 2025, more than four times its 2019 figure, moving India from 16th to 6th among its markets. Sri Lanka received 531,511, up by half. Thailand received 2.49 million, 17 per cent more than in 2024.
Taiwanese and South Korean travellers are back above 2019. Departures from Taiwan reached 18.9 million in 2025, 11 per cent above 2019, and 6.7 million of those trips had Japan as their first destination. South Korea’s outbound departures were 3 per cent above 2019 in 2025, though they slipped back to 99 per cent of 2019 in January to August 2026. In South Korea’s own inbound figures, visitors from Taiwan rose 50 per cent on 2019, the largest gain of any market.
Long-haul travellers are making up ground. In Thailand, arrivals from Europe, a ministry grouping that includes Russia, rose 12 per cent in 2025, while arrivals from Asia and the Pacific fell 14 per cent. Australians were up on 2019 in all four destinations we checked where they are a leading market: by 43 per cent in Vietnam, 27 per cent in Indonesia, 18 per cent in Sri Lanka and 11 per cent in Singapore. Visitors from the United States to South Korea rose 42 per cent on 2019.
Russian travellers are a growing presence on the region’s beaches. Arrivals from Russia to the Maldives more than tripled between 2019 and 2025, making Russia the island nation’s second-largest market on press-reported ministry figures. In Sri Lanka they more than doubled, and Thailand received 1.9 million Russian visitors in 2025, 9 per cent more than in 2024. In Vietnam, Russian arrivals in January to August 2026 were 2.7 times the same months of 2025, at just over one million.
And the traveller who stayed home is Japanese. Japanese nationals made 14.7 million trips abroad in 2025, according to JNTO, against 20.1 million in 2019: 27 per cent fewer, six years on, and growth slowed to under 3 per cent in January to August 2026 (August is a JNTO estimate). The weak yen that draws visitors into Japan also makes travel out of it more expensive, which is a plausible explanation, though no official source we found states it. The effect is visible in its neighbours’ figures: Japanese arrivals to Singapore were 29 per cent below 2019 in 2025, and to Vietnam 14 per cent below.
Japan and Thailand, side by side
In 2019 Thailand received 39.9 million international arrivals and Japan 31.9 million. Six years later they had swapped places by a wide margin.
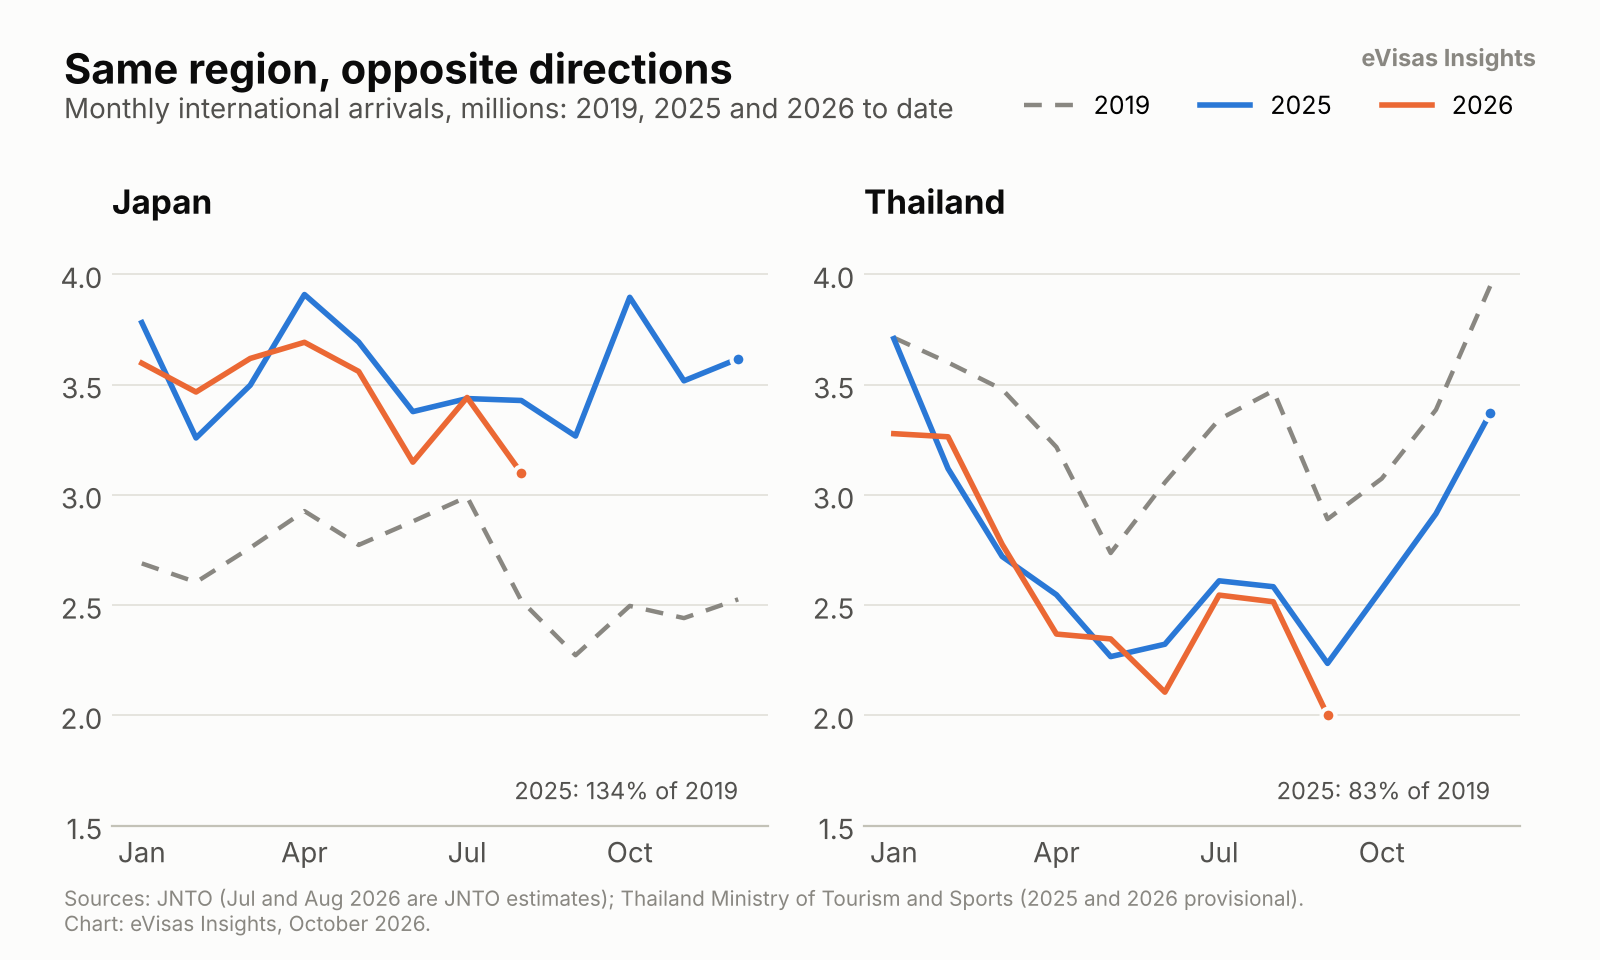
Chart 6. Monthly international arrivals to Japan and Thailand in 2019, 2025 and 2026 to date. Sources: JNTO; Thailand Ministry of Tourism and Sports.
Japan: a record built mostly on other markets. Japan received 42,683,301 international visitors in 2025, up 15.8 per cent on 2024 and 34 per cent above 2019, according to JNTO. The Japan Tourism Agency estimates visitor spending at about ¥9.5 trillion, roughly double 2019’s ¥4.8 trillion. What is easy to miss is that Chinese arrivals, even in their strong 2025, were still only 95 per cent of their 2019 level. Japan’s record came from everywhere else. Excluding mainland China, Japan received 33.6 million visitors in 2025 against 22.3 million in 2019, an increase of 51 per cent. South Korea (9.46 million), Taiwan (6.76 million) and the United States (3.31 million) were the largest contributors; all three were far above their 2019 levels.
Two qualifications belong next to those numbers. First, Japan’s 2019 base was unusually low for Korean visitors: JNTO’s figures show Korean arrivals falling by roughly half or more year on year in every month from August to December 2019, which flatters any comparison with that year. Second, a weak yen made Japan much cheaper for most visitors. On the US Federal Reserve’s official annual averages the yen bought about 27 per cent fewer US dollars in 2025 than in 2019.
The 2026 test of Japan’s model has been severe and it has held. With Chinese arrivals down 57 per cent in January to August 2026, Japan’s total for those months was only 2.7 per cent lower than in 2025, and still 25 per cent above the same months of 2019. South Korea rose 21 per cent, Taiwan 20 per cent and Hong Kong 9 per cent.
Thailand: the opposite shape. Thailand received 32,974,321 international tourists in 2025, down 7.2 per cent on 2024 and 17 per cent below its revised 2019 total of 39,916,251, according to the Ministry of Tourism and Sports. Arrivals fell year on year in every month of 2025 except January, when the Lunar New Year fell late in the month. In January to September 2026 they are 3.8 per cent lower again, at 23.2 million, which is 79 per cent of the same months of 2019.
China explains most, not all, of Thailand’s decline. Two smaller factors are visible in official data. Arrivals from Cambodia fell 54 per cent in 2025, with falls of 87 to 95 per cent in every month from August, after armed clashes broke out on the border on 24 July 2025. And the baht strengthened by about 7 per cent against the US dollar in 2025 compared with 2024, on the Federal Reserve’s annual averages, which made Thailand more expensive for visitors while the yen remained far weaker than in 2019.
Thailand’s visitor mix is also changing underneath the headline. Arrivals from Europe rose 12 per cent in 2025 and from South Asia 16 per cent, while arrivals from North-East Asia fell 25 per cent. Visitors from South Korea, once a dependable market, were down 17 per cent on 2024.
Follow the money
Arrival counts tell only half the story. Spending tells the other half, and on that measure the gap between Japan and Thailand is wider still.
Japan: twice the money (measured in yen). Visitor spending in Japan in 2025, about ¥9.5 trillion on the Japan Tourism Agency’s estimate, was 96 per cent higher than in 2019, while visitor numbers were 34 per cent higher. On those figures the average visitor spent about 47 per cent more yen per trip than in 2019. Most of that is the exchange rate and higher prices rather than more generous visitors: measured in US dollars, total spending was about 43 per cent above 2019 and spending per visitor about 7 per cent higher. Either way, Japan’s recovery in money terms has outpaced its recovery in arrivals.
Thailand: four-fifths of the money. Thailand’s international tourism receipts in 2025 were 83 per cent of their 2019 level in baht, and about 78 per cent measured in US dollars, on the Ministry of Tourism and Sports’ figures. Receipts from Chinese visitors were 45 per cent of their 2019 level.
Worldwide, money has recovered a little faster than people. UN Tourism’s May 2026 Barometer estimates international tourism receipts in 2025 at 6 per cent above 2019 in real terms, with growth “mostly in Asia and the Pacific and Africa”. In the first half of 2026, its September edition reported receipts up 36 per cent in South Korea, 32 per cent in Laos and 23 per cent in Malaysia compared with the first half of 2025. On the spending side, UN Tourism’s January 2026 Barometer puts India’s international tourism spending for January to November 2025 at 88 per cent above the same period of 2019, measured in rupees, one of the clearest signs of how fast Indian travel is growing.
What is driving the gap
Pulling the country evidence together, the shortfall in Asia-Pacific has at least six distinct causes, and different destinations are exposed to different combinations of them.
Chinese outbound travel. Still about 4 per cent below 2019 in total, and highly mobile between destinations. Where that flow moved away, as from Thailand in 2025 and Japan in 2026, the effect showed within a month; where it moved towards, as South Korea, growth accelerated. In Taiwan, mainland arrivals have not returned at all.
Safety perceptions and diplomatic decisions. Official sources name these directly in the cases of Thailand in 2025 (the Bank of Thailand) and Japan in 2026 (the Chinese Foreign Ministry’s notice and JNTO’s commentary). Both moved hundreds of thousands of visitors a month.
Currency. The yen’s weakness against the dollar since 2019 is one plausible reason Japan outperformed even with fewer Chinese visitors; the baht’s strength in 2025 worked the other way for Thailand. This is our interpretation of official exchange-rate data, not a figure any tourism authority has calculated.
Fewer Japanese travellers. Japan’s outbound travel is still 27 per cent below 2019. For destinations that relied on Japanese visitors, the gap is visible: in Singapore, Japanese arrivals were 29 per cent below 2019 in 2025, and no single market has made up the difference.
Air links. JNTO’s monthly commentary repeatedly credits new seat capacity for growth from South Korea, and reduced flights for falls from China, Thailand and the Philippines in 2026. UN Tourism’s September 2026 Barometer cites disrupted air connectivity and higher airfares across 2026, after the Middle East conflict closed airspace used by many long-haul routes. Maldives arrivals, published by its Ministry of Tourism and reproduced in the Maldives Monetary Authority’s database, were well below 2025 from March to June 2026 and recovered from July, the same window as the closures. That timing is suggestive; we have not found an official statement that links the two.
Deliberate policy. Some shortfalls are chosen rather than cyclical. Bhutan reopened in 2022 with a higher sustainable development fee, which for the first time also applied to regional visitors who had made up about three quarters of its 2019 arrivals; its 66 per cent figure reflects a “high value, low volume” policy, not just weak demand.
A separate case. Myanmar, at about a fifth of its 2019 arrivals, is not explained by any of the factors above, and the figures available to us do not allow a fair account of it.
2026 so far
The first half of 2026 brought only 1 per cent growth for the region as a whole, according to UN Tourism, which left it 11 per cent below the first half of 2019. Underneath, the same divergence continued.
Table 4. Asia-Pacific destinations, 2026 year to date against the same period of 2025
Sources: UN Tourism, World Tourism Barometer, September 2026 (Bhutan and Mongolia); national tourism authorities and statistics offices, and for secondary figures the news agencies quoting them, listed in the methodology. Periods differ between rows, so compare each row with its own period rather than ranking them against each other. All 2026 figures are provisional.
South Korea and Vietnam are the clearest gainers. In South Korea’s case, the growth is led by mainland China: Chinese arrivals were up 29 per cent in January to August 2026. In Vietnam, the largest increases came from Russia, Cambodia, the Philippines, India and the United States, while Chinese arrivals were flat. Japan and Thailand are both slightly down, for different reasons. New Zealand’s July 2026 arrivals were slightly above July 2019, the first month since the pandemic in which it exceeded its pre-pandemic level. Cambodia’s fall is the sharpest in the table; the figure comes from the Ministry of Tourism as reported by the Vietnam News Agency, and we were not able to read the ministry’s own breakdown.
Where to go in Asia now, and what to check first
For travellers, this data answers a practical question: where have the visitors fully returned, and where have they not?
Above their 2019 level. Japan, Vietnam, South Korea and Sri Lanka all received more international visitors in 2025 than in 2019. In Vietnam and South Korea, numbers are up again in 2026; Japan and Sri Lanka are slightly down on 2025 so far, but from a much higher base. Expect busier peak periods and plan accommodation and internal travel earlier than you would have before 2020.
Still below their 2019 level. Thailand, Taiwan, Cambodia, Singapore, Indonesia and India (on foreign tourist arrivals) all received fewer international visitors in 2025 than in 2019. Thailand, Cambodia and Singapore are lower again in 2026. That does not mean any particular beach, temple or festival will be quiet, but at the national level these destinations hosted fewer international visitors in 2025 than in 2019.
Whichever you choose, the entry rules are the step most travellers leave until last, and they are not the same across the region. What you need depends on your passport, the length and purpose of your stay, and sometimes on where you live. Several destinations, including Singapore, Thailand and Malaysia, also ask most visitors to complete a digital arrival card before they land, in addition to any visa or travel authorisation. Rules in this region have changed repeatedly since 2020, and an article or forum post from even a year ago may no longer describe them.
Check what you need for each destination before you book:
1. Japan · Vietnam · South Korea · Sri Lanka
2. Thailand · Taiwan · Cambodia · Laos
3. Singapore · Malaysia · Indonesia · India
Each page sets out who needs what, how long it is valid for, and what the application asks for. eVisas checks every application for completeness and accuracy before submission, tracks it, and supports you until the decision.
Methodology and limitations
Regional figures. UN Tourism, World Tourism Barometer, September 2026 edition (data to the first half of 2026), and January and May 2026 editions where stated. Regional 2025 against 2019 comparisons are calculated by eVisas from UN Tourism’s published 2019 and 2025 totals, except for the Middle East, where UN Tourism states the figure. First-half 2026 against 2019 figures are UN Tourism’s own.
Country league table. For each destination we took full calendar-year international arrivals for 2019 and 2025 from the national official source and divided one by the other. Where a country publishes more than one series, we chose the one closest to overnight international visitors: India’s foreign tourist arrivals rather than its international tourist arrivals, which add non-resident Indians and would put India at 113 per cent of 2019; China’s National Bureau of Statistics count of foreign inbound visitors rather than immigration crossings; Brunei’s air arrivals, because a 2024 change to how land arrivals are counted breaks its total series. Hong Kong, Macao and Malaysia publish headline series that include same-day visitors; they are shown for reference and excluded from the counts and the median.
Sources by destination. Japan: JNTO and the Japan Tourism Agency. Thailand: Ministry of Tourism and Sports, 2019 revised series. China: National Bureau of Statistics and Ministry of Culture and Tourism communiques; National Immigration Administration. Hong Kong: Hong Kong Tourism Board. Macao: Statistics and Census Service. South Korea: Korea Tourism Organization. Taiwan: Tourism Administration. Mongolia: National Statistics Office. Vietnam: National Statistics Office and Vietnam National Authority of Tourism. Malaysia: Tourism Malaysia. Singapore: Singapore Tourism Board. Indonesia: Statistics Indonesia. Philippines: Department of Tourism. Cambodia: Ministry of Tourism. Laos: Tourism Development Department. Myanmar: Ministry of Hotels and Tourism. Brunei: Tourism Development Department. India: Ministry of Tourism. Sri Lanka: Sri Lanka Tourism Development Authority. Maldives: Ministry of Tourism and Maldives Monetary Authority. Nepal: Nepal Tourism Board. Bhutan: Department of Tourism. Australia: Australian Bureau of Statistics. New Zealand: Stats NZ. Fiji: Fiji Bureau of Statistics. Samoa: Samoa Bureau of Statistics. Papua New Guinea: Tourism Promotion Authority. Source markets and outbound travel: Korea Tourism Organization Data Lab; Vietnam National Statistics Office and Vietnam National Authority of Tourism; Singapore Tourism Board via SingStat; Sri Lanka Tourism Development Authority; Statistics Indonesia; Maldives Bureau of Statistics and Ministry of Tourism; Cambodia Ministry of Tourism; India Ministry of Tourism; Taiwan Tourism Administration; JNTO; China’s State Administration of Foreign Exchange for travel spending. Receipts: Japan Tourism Agency; Thailand Ministry of Tourism and Sports; UN Tourism. Exchange rates: US Federal Reserve, G.5A annual averages.
Limitations.
1. Definitions differ. Some countries count visitors, some tourists; some count trips and some people; some include citizens resident abroad (Samoa, the Philippines) or cruise passengers (Papua New Guinea). Australia and New Zealand count all short-term visitors, including those travelling for business, study or family. We flag the largest differences, but the table compares each country with itself, not countries with each other.
2. 2019 was not normal everywhere. Sri Lanka’s 2019 total was depressed by the Easter Sunday attacks; against 2018, its 2025 figure is 101 per cent rather than 123 per cent. Japan’s 2019 Korean arrivals were unusually low in the second half of the year.
3. Provisional data. Most 2025 and all 2026 figures are provisional and will be revised.
4. UN Tourism revised its 2025 regional totals between January and September 2026.
5. China and the Philippines. China’s 2025 foreign visitor figure was read in the official communique as reprinted by People’s Daily, and its 2019 base may include border residents, so the 110 per cent figure is indicative. The Philippines’ 2025 figure includes overseas Filipinos; we could not confirm that its 2019 figure is defined the same way, and its 2026 series was revised in September 2026.
6. Secondary figures. Where an official site could not be read, we used an official figure as quoted by a news agency or newspaper, and mark it as secondary. South Korea’s 2019 figure is implied from the 108 per cent recovery rate the Korea Tourism Organization reported.
7. Source-market figures. Maldives 2025 market figures are official figures reported by the press. Cambodia’s 2025 market figures come from a company investor-relations page reproducing Ministry of Tourism data, and its 2019 figures from a copy of the ministry’s report hosted elsewhere. South Korea’s outbound total includes crew, as in the Korea Tourism Organization’s own recovery figure, and India’s 2025 departures are provisional. Taiwan’s departures to Japan are counted by first destination. Spending per visitor in Japan is our calculation from the Japan Tourism Agency’s totals and JNTO’s arrivals. China’s SAFE travel spending and the receipts comparisons for Japan and Thailand are nominal, not adjusted for inflation.
8. Causes are interpretation. The figures in this article are measured. The explanations draw on official statements where they exist (the Bank of Thailand, the Chinese Foreign Ministry, JNTO) and are labelled as our interpretation where they do not.
The dataset. The full league table, with each figure’s source, definition and grade, is published alongside this article under a Creative Commons Attribution 4.0 licence. Reuse it with credit to eVisas.
Frequently asked questions
Has international tourism recovered to pre-pandemic levels?
Worldwide, yes. UN Tourism estimates about 1.54 billion international tourist arrivals in 2025, 4 per cent above 2019, and the first half of 2026 was also 4 per cent above the first half of 2019. Europe, Africa and the Middle East are above their 2019 levels, and the Americas were level with 2019 in 2025 and slightly above it in the first half of 2026. Asia and the Pacific is the exception.
Which region has recovered the most?
Measured against 2019, the Middle East was furthest ahead in 2025, at 40 per cent above, but it fell 22 per cent in the first half of 2026 because of the regional conflict. In the first half of 2026, Africa was furthest ahead, at 29 per cent above the first half of 2019.
Why is tourism in Asia still below 2019?
There is no single cause. Outbound travel from mainland China, one of the region’s largest source markets, was still about 4 per cent below 2019 in 2025, and its sharp shifts between destinations hit Thailand in 2025 and Japan in 2026. For 2026, UN Tourism also cites disrupted air connectivity, higher airfares and uncertainty. Safety perceptions, exchange rates, air capacity and deliberate national policies all played a part in individual countries.
Why have Thailand’s tourist numbers fallen?
Thailand received 32.97 million international tourists in 2025, 7 per cent fewer than in 2024 and 17 per cent fewer than in 2019. About 88 per cent of the fall from 2024 came from mainland China, where arrivals dropped by 2.26 million. The Bank of Thailand attributed the slow Chinese recovery to safety concerns. A smaller fall in visitors from Cambodia after the July 2025 border clashes also contributed, and a stronger baht likely played a part.
Where are Chinese tourists going now?
In 2026, increasingly to South Korea: Chinese arrivals there were up 29 per cent in January to August 2026 and 23 per cent above the same months of 2019. Arrivals to Japan fell 57 per cent over the same period after Beijing’s November 2025 travel advisory, and arrivals to Thailand recovered 16 per cent from a weak 2025. Of ten destinations we compared, only the Maldives received more Chinese visitors in 2025 than in 2019.
Which countries’ travellers are helping Asia recover?
Travellers from India, Taiwan and South Korea all made more trips abroad in 2025 than in 2019, India by 22 per cent, and long-haul visitors from Europe, Australia and the United States are also growing. They have not fully replaced the trips still missing from China and Japan. Japanese outbound travel is the main absence, still 27 per cent below 2019.
Did Japan break its tourism record in 2025?
Yes. JNTO recorded 42,683,301 international visitors in 2025, up 15.8 per cent on 2024 and 34 per cent above 2019, and the Japan Tourism Agency estimates visitor spending at about ¥9.5 trillion, also a record. Visitors from mainland China fell sharply after November 2025, but Japan’s total for January to August 2026 was only 3 per cent lower than a year earlier.
Is Asia-Pacific tourism recovering in 2026?
Slowly. UN Tourism reports 1 per cent growth for the region in the first half of 2026, which left it 11 per cent below the first half of 2019. South Korea and Vietnam are growing strongly; Japan, Thailand, Singapore and Sri Lanka are slightly down on 2025.
Conclusion
The pandemic recovery is usually described as finished. For the world, it is. For Asia and the Pacific, it is not, and the reason is not one region-wide failure but a series of national outcomes that pull in opposite directions. Japan broadened its visitor base well beyond China and set records, then absorbed the loss of more than half its Chinese visitors in 2026 with barely a dent. Thailand lost ground when Chinese visitors moved away in 2025 and has not yet regained it. South Korea became the main beneficiary of the third move, with its busiest months since at least 2019. Behind all of it, travellers from India, Taiwan and South Korea are taking a larger share of the region’s visitors, though not yet enough to make up for the Chinese and Japanese trips that have not returned. Taiwan, the Philippines, Bhutan, Papua New Guinea and Myanmar are further behind still, each for its own reasons.
For anyone using these numbers, the practical point is to stop reading the regional average. It describes almost no country in the region. For anyone travelling, the practical point is simpler: check how busy your destination has become, and check its entry requirements, before you book.