What a Conflict Costs a Region's Tourism, Measured
 Elena DarziSeptember 1, 202645 min read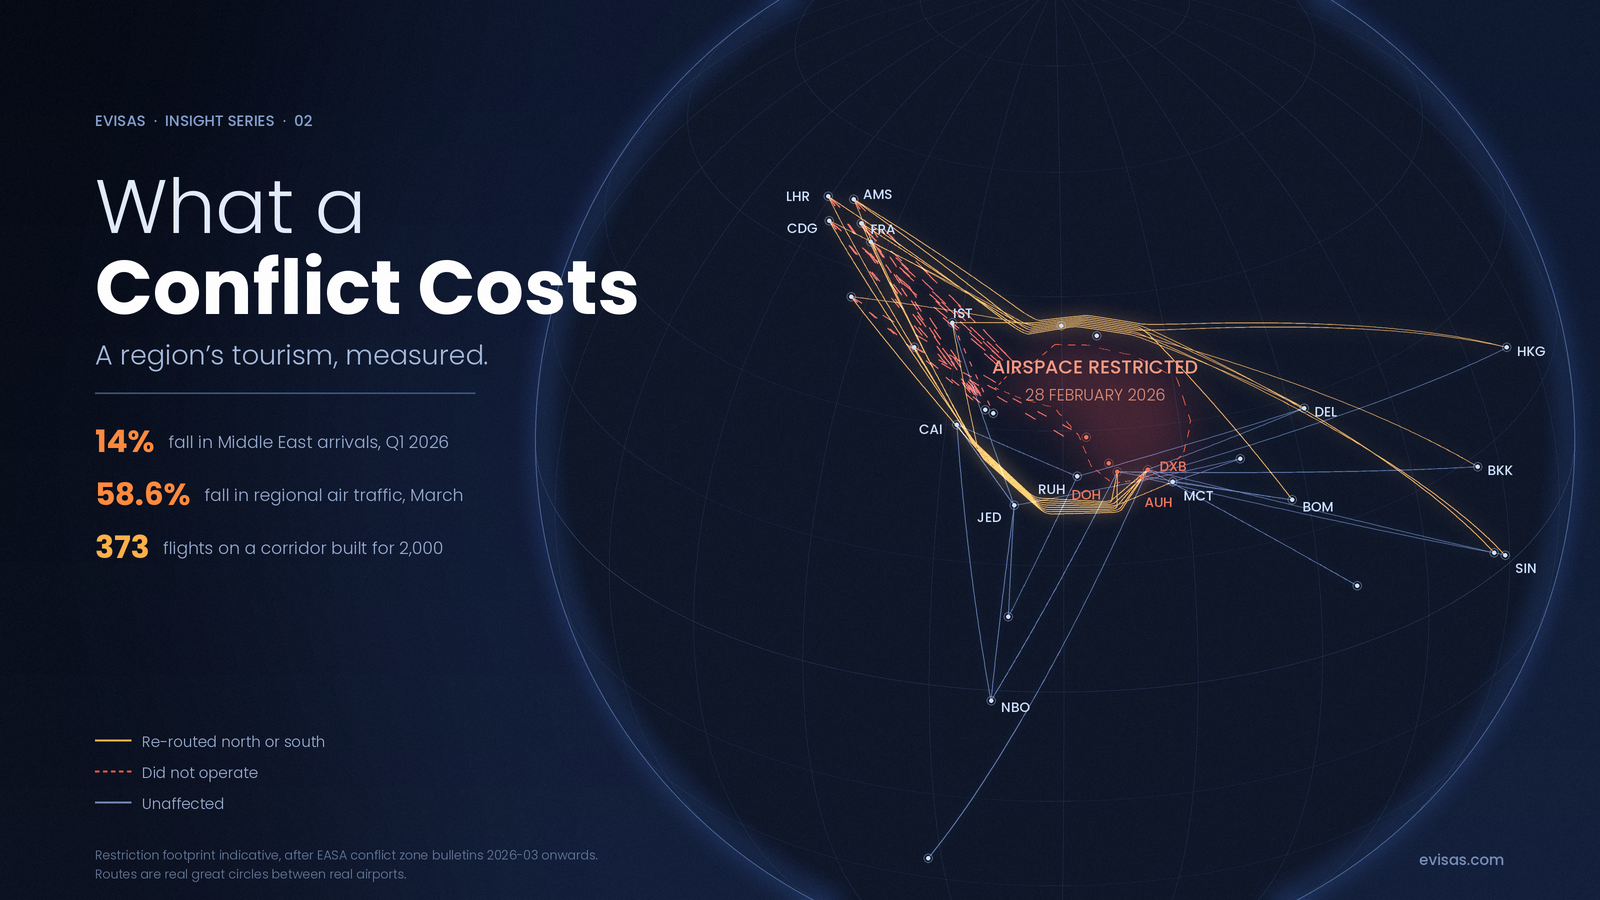
In January 2026, Qatar received 646,000 visitors. In February, 423,000. In March, 63,000.
That is the same country across three consecutive months, and it is the steepest month-to-month fall any statistical office in the region has published this year. Qatar Tourism released the figures through the state news agency without a year-on-year comparison, so how much of the January-to-February decline is ordinary seasonality cannot be read off the published data. The March figure is a different matter: airspace across the region closed on 28 February.
Geopolitical disruption is usually described rather than measured. It gets adjectives, devastating, unprecedented, catastrophic, and very few decimal points. But this particular shock happened to fall across three of the best-instrumented measurement systems in international travel, all free to read and none of them sharing a data pipeline with the others. One counts tourists, one counts passenger kilometres, one counts flights. They agree.
This article measures the size of the shock, how fast it arrived, how fast it has decayed, what it cost the rest of the world, and, using seven previous shocks where the data is good, roughly how long the recovery is likely to take. Every figure is sourced. Where the sources disagree, we say so.
What happened, in operational terms only
On 28 February 2026, according to EUROCONTROL’s own timestamped record, Israeli and Iranian airspace closed at 06:30 UTC. The European Aviation Crisis Coordination Cell was activated at 07:32. Iraqi airspace closed at 07:40. The southern part of Syrian airspace and Bahraini airspace closed at 08:30. Qatari airspace closed at 08:40.
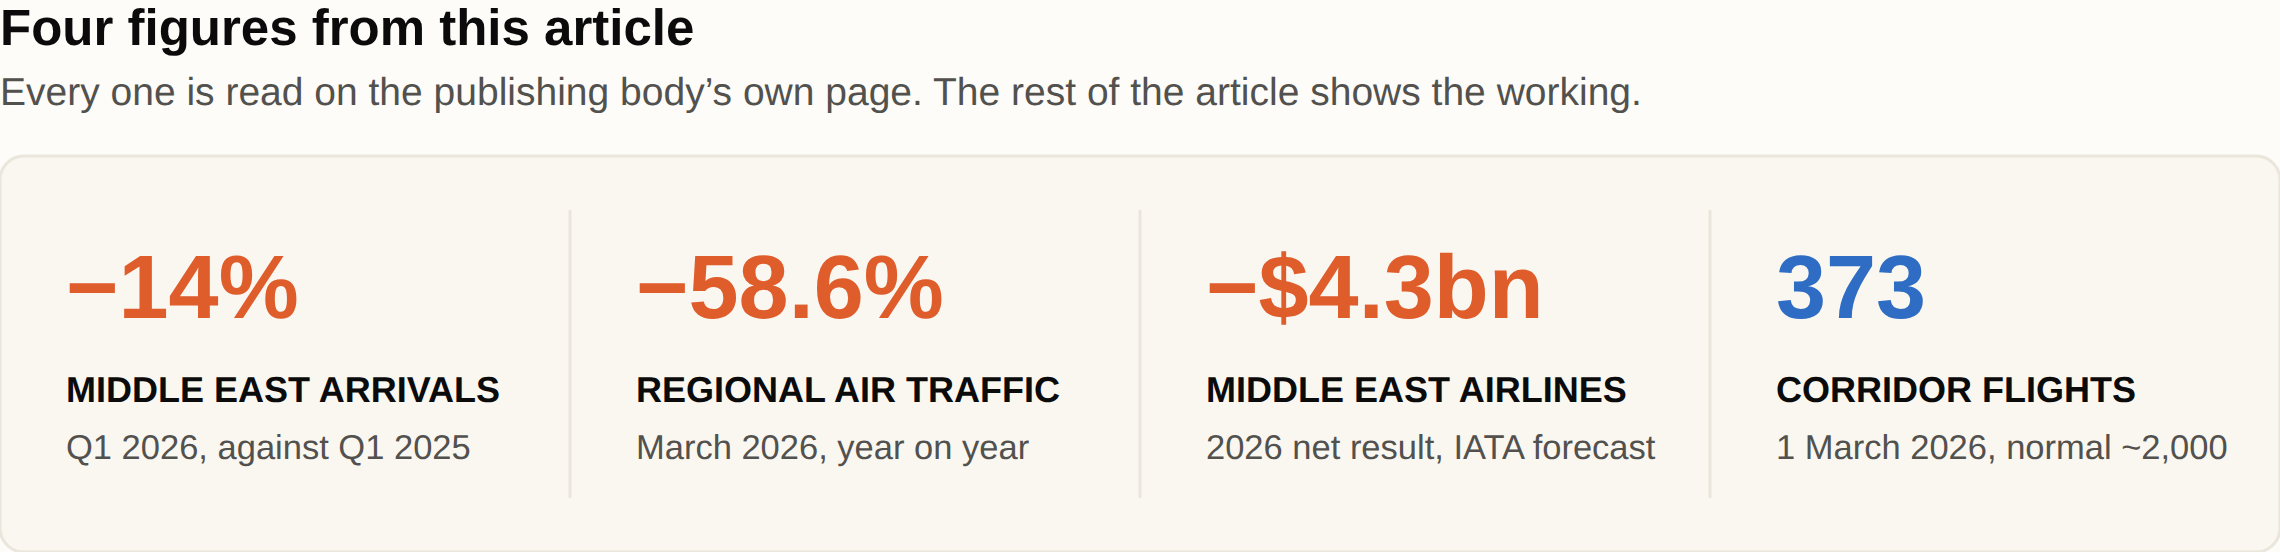
Inside about two hours, a corridor that carries roughly 2,000 flights a day between Europe and the Middle East stopped functioning. On 1 March 2026, 373 flights operated on it.
The European Union Aviation Safety Agency issued Conflict Zone Information Bulletin 2026-03, “Airspace of the Middle East and Persian Gulf”, the same day. At its widest it covered eleven flight information regions: Bahrain, Iran, Iraq, Israel, Jordan, Kuwait, Lebanon, Oman, Qatar, the United Arab Emirates and Jeddah. It was extended thirteen times.
We are not going to characterise the conflict. IATA describes it as “the US-Israel-Iran war, which closed much of the airspace in the region”. UN Tourism refers to “the outbreak of the conflict on 28 February 2026”. Those are the two descriptions used by the bodies whose numbers this article relies on, and they are sufficient for the purpose.
The headline finding: three instruments, one curve
The reason this shock can be measured with unusual confidence is that three organisations with different methods, different units and different reporting frequencies produced the same shape. Chart 1 plots two of them, because they share an axis; the third is quoted alongside.
UN Tourism counts arrivals. In its May 2026 World Tourism Barometer, revised in July, it reports 307 million international tourist arrivals worldwide in the first quarter of 2026, about 6 million more than the first quarter of 2025 and 2 per cent up. Four of five world regions grew: Europe 4 per cent, Africa 4 per cent, Asia and the Pacific 3 per cent, the Americas 2 per cent. The Middle East fell 14 per cent. It is the only world region that declined.
Read monthly rather than quarterly, the same publication is starker. Global arrivals grew 2 per cent in January and 3 per cent in February. In March they were flat, at plus 0.4 per cent, and UN Tourism attributes that to a 37 per cent decline in the Middle East in a single month.
IATA counts revenue passenger kilometres. Its monthly series for Middle Eastern carriers runs: −58.6 per cent in March, −46.6 per cent in April, −28.4 per cent in May, −13.9 per cent in June, −10.0 per cent in July, each against the same month of 2025, total market. Through July, the year-to-date position for the region is −21.1 per cent on demand and −17.4 per cent on capacity.
EUROCONTROL counts flights. Its fortnightly Europe-Middle East series runs −20 per cent in the week of the outbreak, −52 per cent in mid-March, −54 per cent in mid-April, −38 per cent in early May, −24 per cent in early June, +7 per cent in the week of 15 to 21 June, +3 per cent at the start of July, then back to −3 per cent, −3 per cent and −2 per cent through the summer.
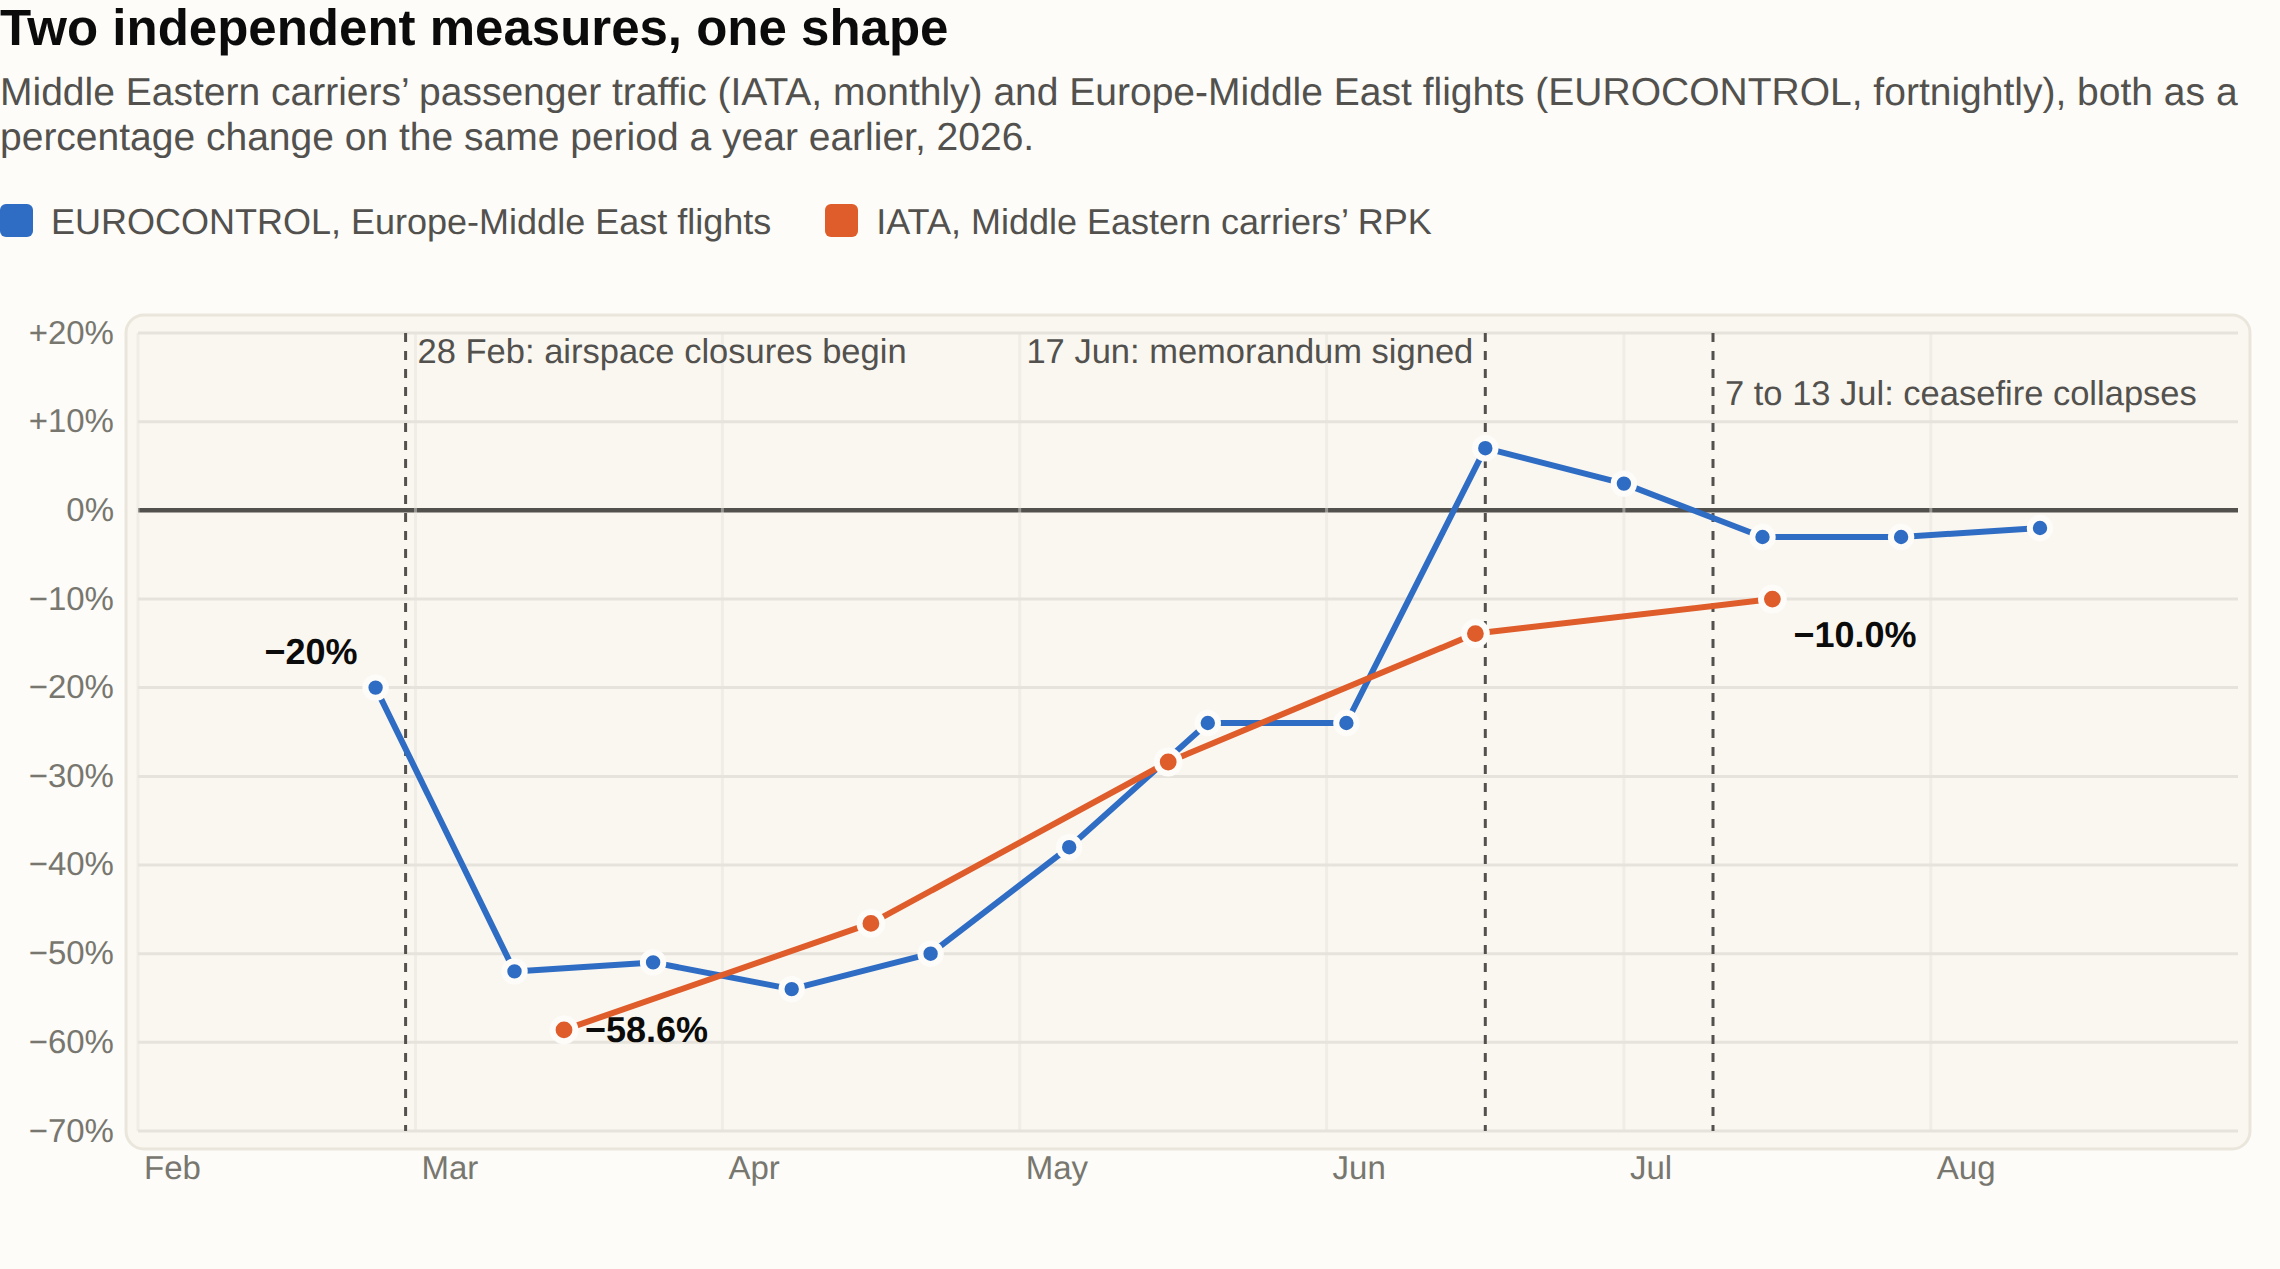
The corroboration is the analytical core of this piece. A single source showing a 58 per cent collapse is a number you would want to check. Three sources measuring three different things and tracing the same rise and fall is a measurement.
Three sources measuring three different things and tracing the same rise and fall is a measurement.
It also tells you something about the mechanism. This did not begin as a gradual loss of appetite for the region. Airspace closed over a matter of hours and the capacity to carry people went with it: Middle Eastern carriers cut available seat kilometres by 54.7 per cent in March. Demand fell further than capacity, by 58.6 per cent, and the difference shows up in the region’s load factor, which dropped to 68.3 per cent, far below the industry’s normal range. So both were at work, with the supply side arriving first and by far the larger.
What the region cost everybody else
The Middle East accounts for 9.5 per cent of global revenue passenger kilometres. That is IATA’s own figure, on a 2025 base, printed in the same monthly table.
Because IATA publishes global growth both as it is and excluding Middle Eastern carriers, the drag on world air travel can be read straight off the page rather than modelled.
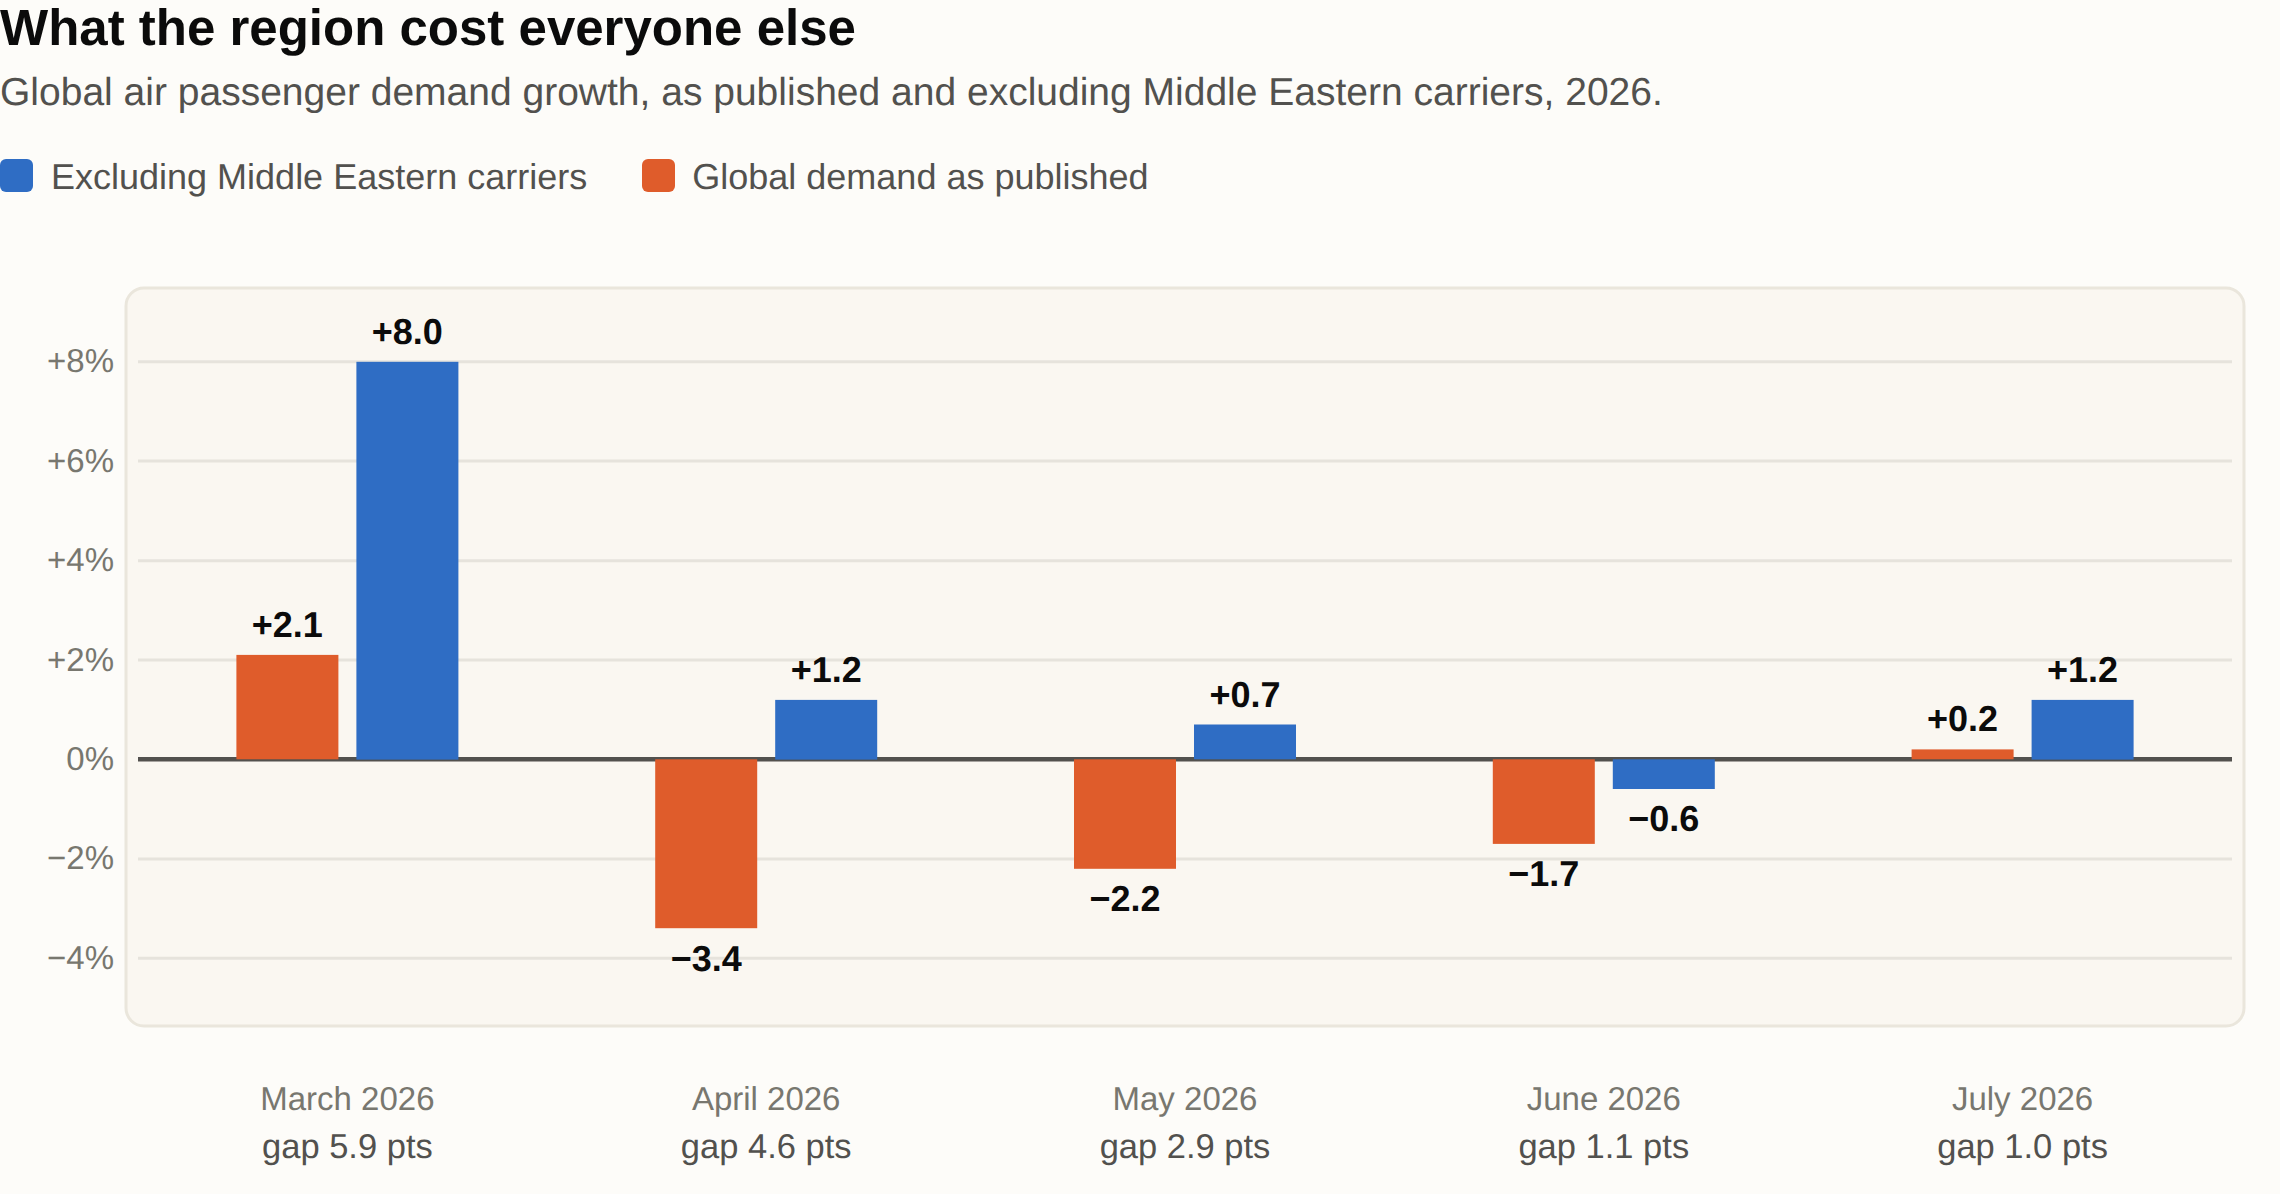
Source: IATA, monthly releases as above. Gaps are the difference between two published figures.
Two of the three months in which global air travel contracted in 2026 were, on IATA’s own reckoning, a Middle East event: take the region out and April and May turn positive. June is the exception. Global demand was still down 0.6 per cent without the Middle East, so that month’s contraction was not solely a regional story. IATA’s Willie Walsh put April plainly: “The 46.6% fall in demand for carriers in the Middle East due to war in the region was so acute that it dragged overall demand down −3.4%.”
The decay of that drag from 5.9 points to 1.0 point in five months is the fastest-improving series in this article.
The physical mechanism: 206,000 extra kilometres a day
Closed airspace does not simply delete flights. It bends the ones that still operate, and the bending has a measurable physical cost. EUROCONTROL published its estimate on 31 March 2026, assuming Iraqi airspace stayed shut while Gulf traffic normalised:
Source: EUROCONTROL, European Aviation Trends Issue 11, 31 March 2026. The figure includes overflights that neither depart from nor land in Europe.
Two hundred and six thousand kilometres a day is about five times the circumference of the Earth, flown for no commercial purpose whatever.
The re-routing redrew the map of who gets overflown. Against the pre-crisis position, EUROCONTROL recorded overflight movements up 26 per cent over Georgia and 6 per cent over Azerbaijan, and down 36 per cent over Türkiye, 29 per cent over Cyprus, 19 per cent over Romania and 17 per cent over Bulgaria. Two corridors emerged: a narrow northern one through Türkiye, Georgia and Azerbaijan threading between Ukrainian, Iranian and Russian airspace, and a wider southern one through Saudi Arabia and Oman.
The Europe-Middle East flow, EUROCONTROL notes, normally represents 5 per cent of all flows to and from Europe. It halved, to 2.5 per cent.
There is a related figure worth knowing, because it shows the shock reaching an entirely different balance sheet. EUROCONTROL’s en-route charges, what airlines pay to fly through European airspace, came in at €952 million in April 2026, down 2 per cent on April 2025, and €853 million in March, down 1 per cent. By July they were €1,207 million, up 3 per cent. Air navigation service providers in Europe felt a Middle Eastern war in their revenue line for two months.
The regional average hides almost everything
“Middle East tourism fell 14 per cent” is true and close to useless as a description of what happened to any particular country.
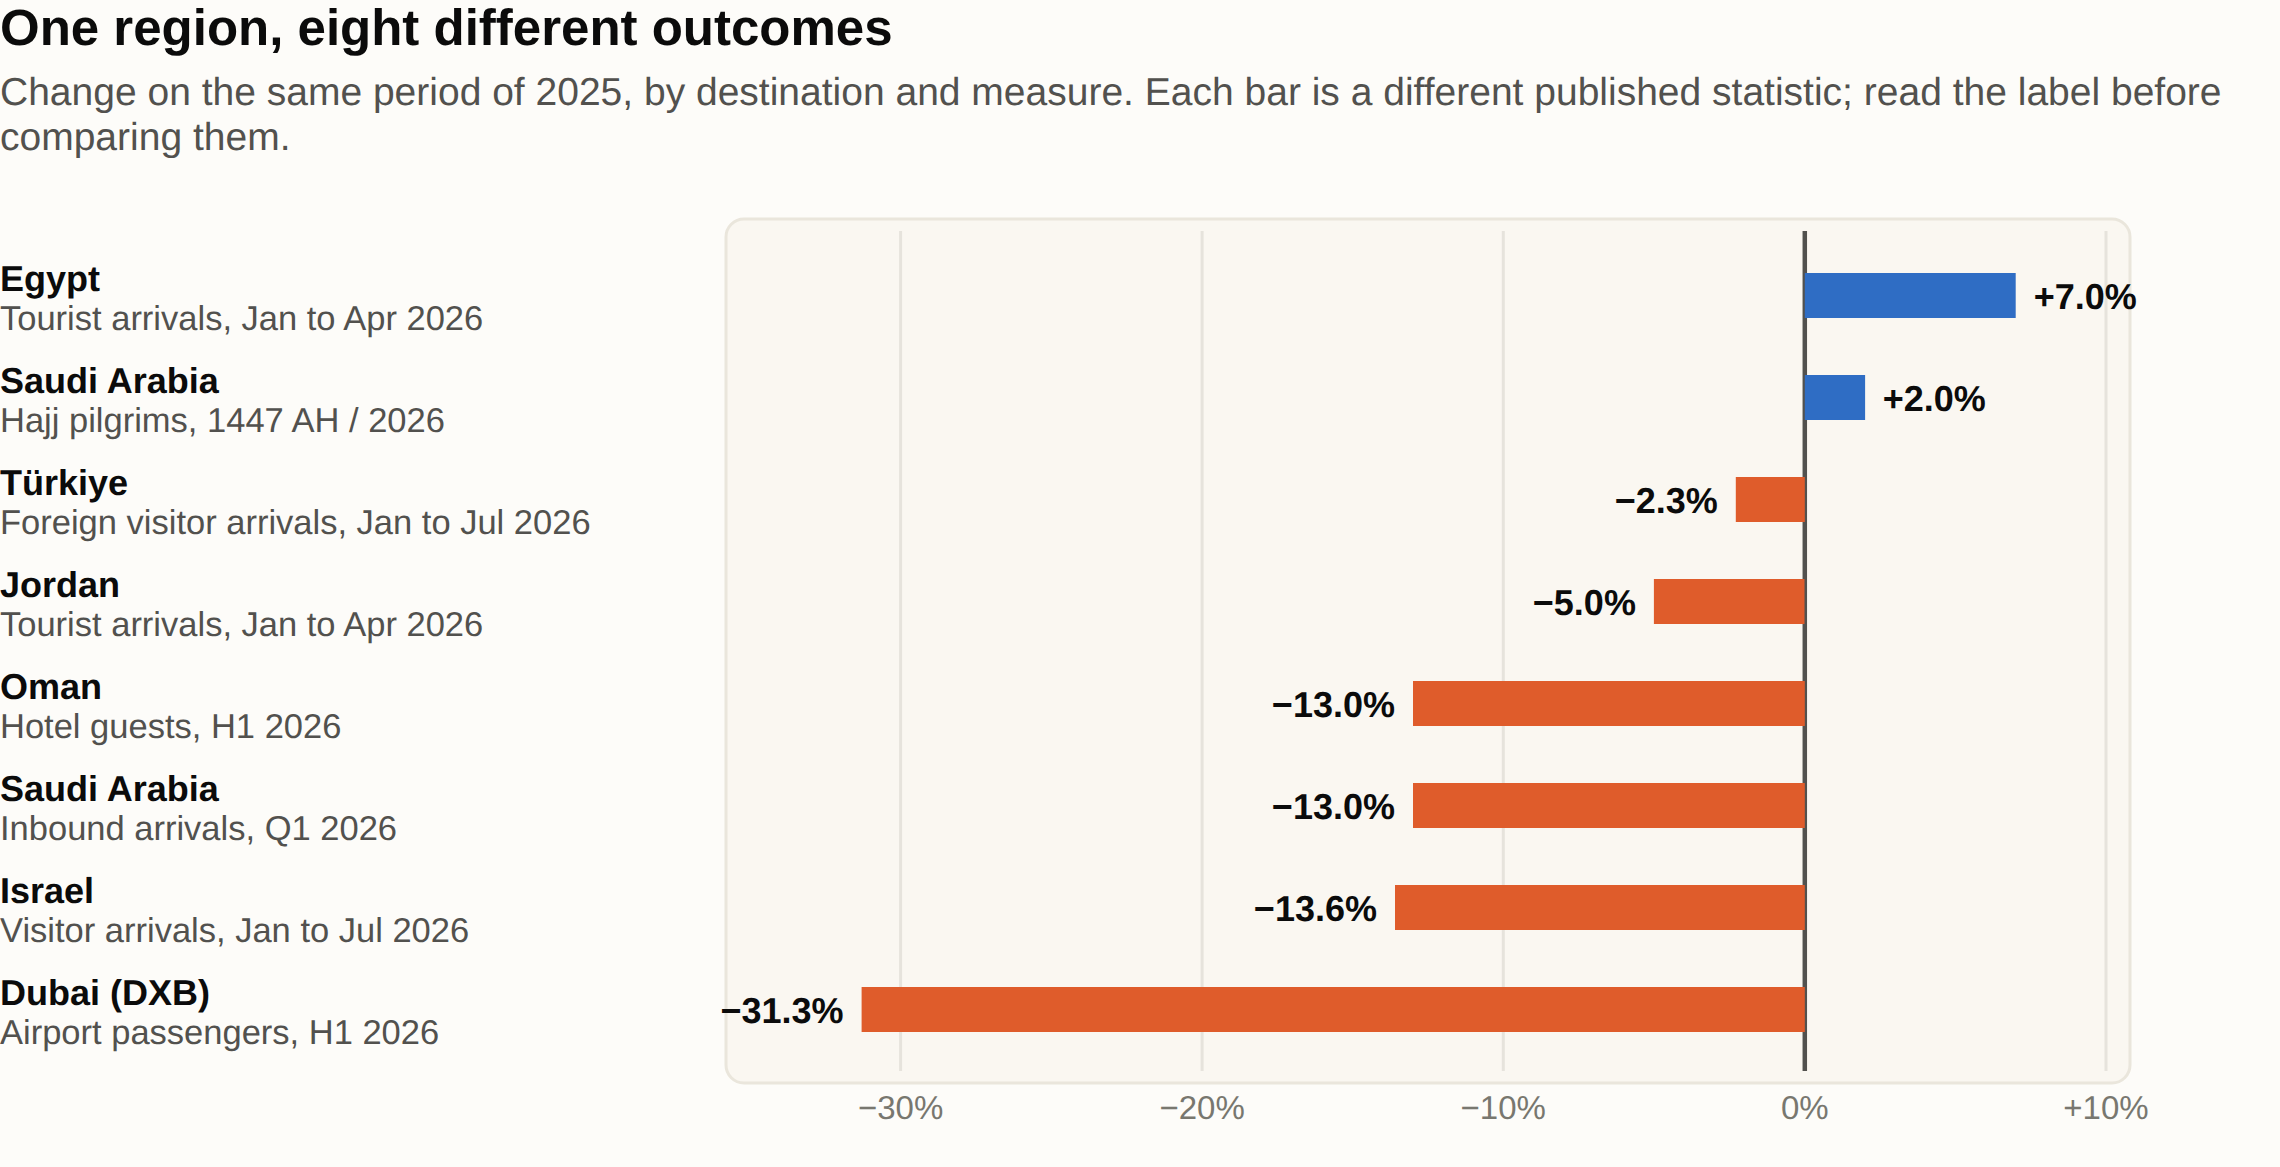
The dividing line is not geography and it is not proximity to the fighting. It is whether a destination’s visitors arrive by long-haul air through the airspace that closed.
Dubai: the cost of being a hub
Dubai Airports reported 31.5 million guests at DXB in the first half of 2026, down 31.3 per cent. Aircraft movements fell 32.1 per cent to 150,600 and cargo fell 28.7 per cent to 751,340 tonnes. The second quarter carried 13 million passengers against 22.5 million in the second quarter of 2025, a fall of about 42 per cent. Within that quarter the monthly numbers climb steadily: 3.5 million in April, 4.5 million in May, 5 million in June.
DXB handled 95.2 million passengers in 2025. Its chief executive, Paul Griffiths, told The National in late August that he expects around 70 million in 2026, and that 56 airlines were operating at the airport against roughly 90 before the war.
That is the price of the connecting-hub model in a single number. Dubai’s traffic is overwhelmingly people passing through the airspace that shut. There was no domestic market to fall back on and no land border that could absorb the volume.
Emirates, which flies most of that traffic, reported 53.2 million passengers in the financial year to 31 March 2026, down 1 per cent, in a year that contained only one month of the war. Its chairman’s statement is the closest thing to a first-hand operational account in any published document: “On 28 February, military activity massively disrupted global commercial air traffic in the Gulf region, including in the UAE… Although we are still operating at a lower passenger capacity than pre-disruption, cargo operations have ramped up to support the movement of essential goods.”
Egypt: the cost of not being one
Egypt kept its airspace open. Egyptian government figures put arrivals for January to April 2026 at 6.1 million, up 7 per cent on 5.7 million a year earlier. UN Tourism’s Barometer separately records Egypt up 16 per cent in the first quarter, the only country it names at all in the regional commentary.
In the first quarter of 2026, in the same region, UN Tourism recorded Middle East arrivals down 14 per cent and Egyptian arrivals up 16 per cent. Across the first half, Dubai’s airport lost nearly a third of its passengers while Egypt, over the first four months, gained 7 per cent more tourists. The periods are not identical, because the two bodies publish on different cycles, but the direction is not in doubt.
Egypt was not immune. Its own tourism minister has said April alone was down 16 per cent. But an April dip inside a rising year is a different order of event from a halving.
Oman: the same country, two numbers
Oman is the clearest illustration of why the measure matters as much as the number. Total inbound visitors in the first half of 2026 came in at about 1.8 million, described by Oman’s state news outlet as similar to the same period of 2025. Over the same six months, hotel statistics from the National Centre for Statistics and Information, carried by the Oman News Agency, show paying hotel guests down 13 per cent, from 1,140,086 to 992,009, with hotel revenue down 12.3 per cent and occupancy down from 54.6 per cent to 46.3 per cent.
Both figures are official. Neither is wrong. Total arrivals held up because GCC visitors kept arriving overland; hotel guests fell because the long-haul flyers who fill hotel rooms did not. A headline that reported only the first number would have described a country that was fine.
Saudi Arabia: obligatory travel is not discretionary travel
Saudi Arabia’s Ministry of Tourism reported 37.2 million total visitors in the first quarter of 2026 and spending of SAR 82.7 billion, with domestic trips up 16 per cent to 28.9 million. It did not publish the inbound figure separately. Disaggregating the ministry’s own totals gives 8.3 million inbound arrivals, down 13 per cent. That figure was released by the consultancy Cavendish Maxwell and reported by Gulf Business, rather than published by the ministry, and one we flag as such.
Then came Hajj. The General Authority for Statistics recorded 1,707,301 pilgrims for 1447 AH, of whom 1,546,655 arrived from outside the Kingdom and 1,485,729 arrived by air. That is up 2.0 per cent on the 1,673,230 recorded the year before, in a pilgrimage that took place roughly three months into the war, largely by air, into the middle of the affected region.
Religious obligation and domestic leisure travel proved almost perfectly insensitive to the shock. Discretionary international travel did not.
The Gulf stopped travelling, too
Almost every account of this shock is about people not arriving in the Gulf. The Turkish border statistics show the other half of it.
Türkiye publishes a monthly bulletin giving arrivals by nationality, compiled from police records. Its July 2026 edition covers January to July and it is, by some distance, the best primary dataset available on this event, because Türkiye is outside the affected airspace and its numbers therefore isolate the behaviour of Gulf travellers from the availability of Gulf flights.
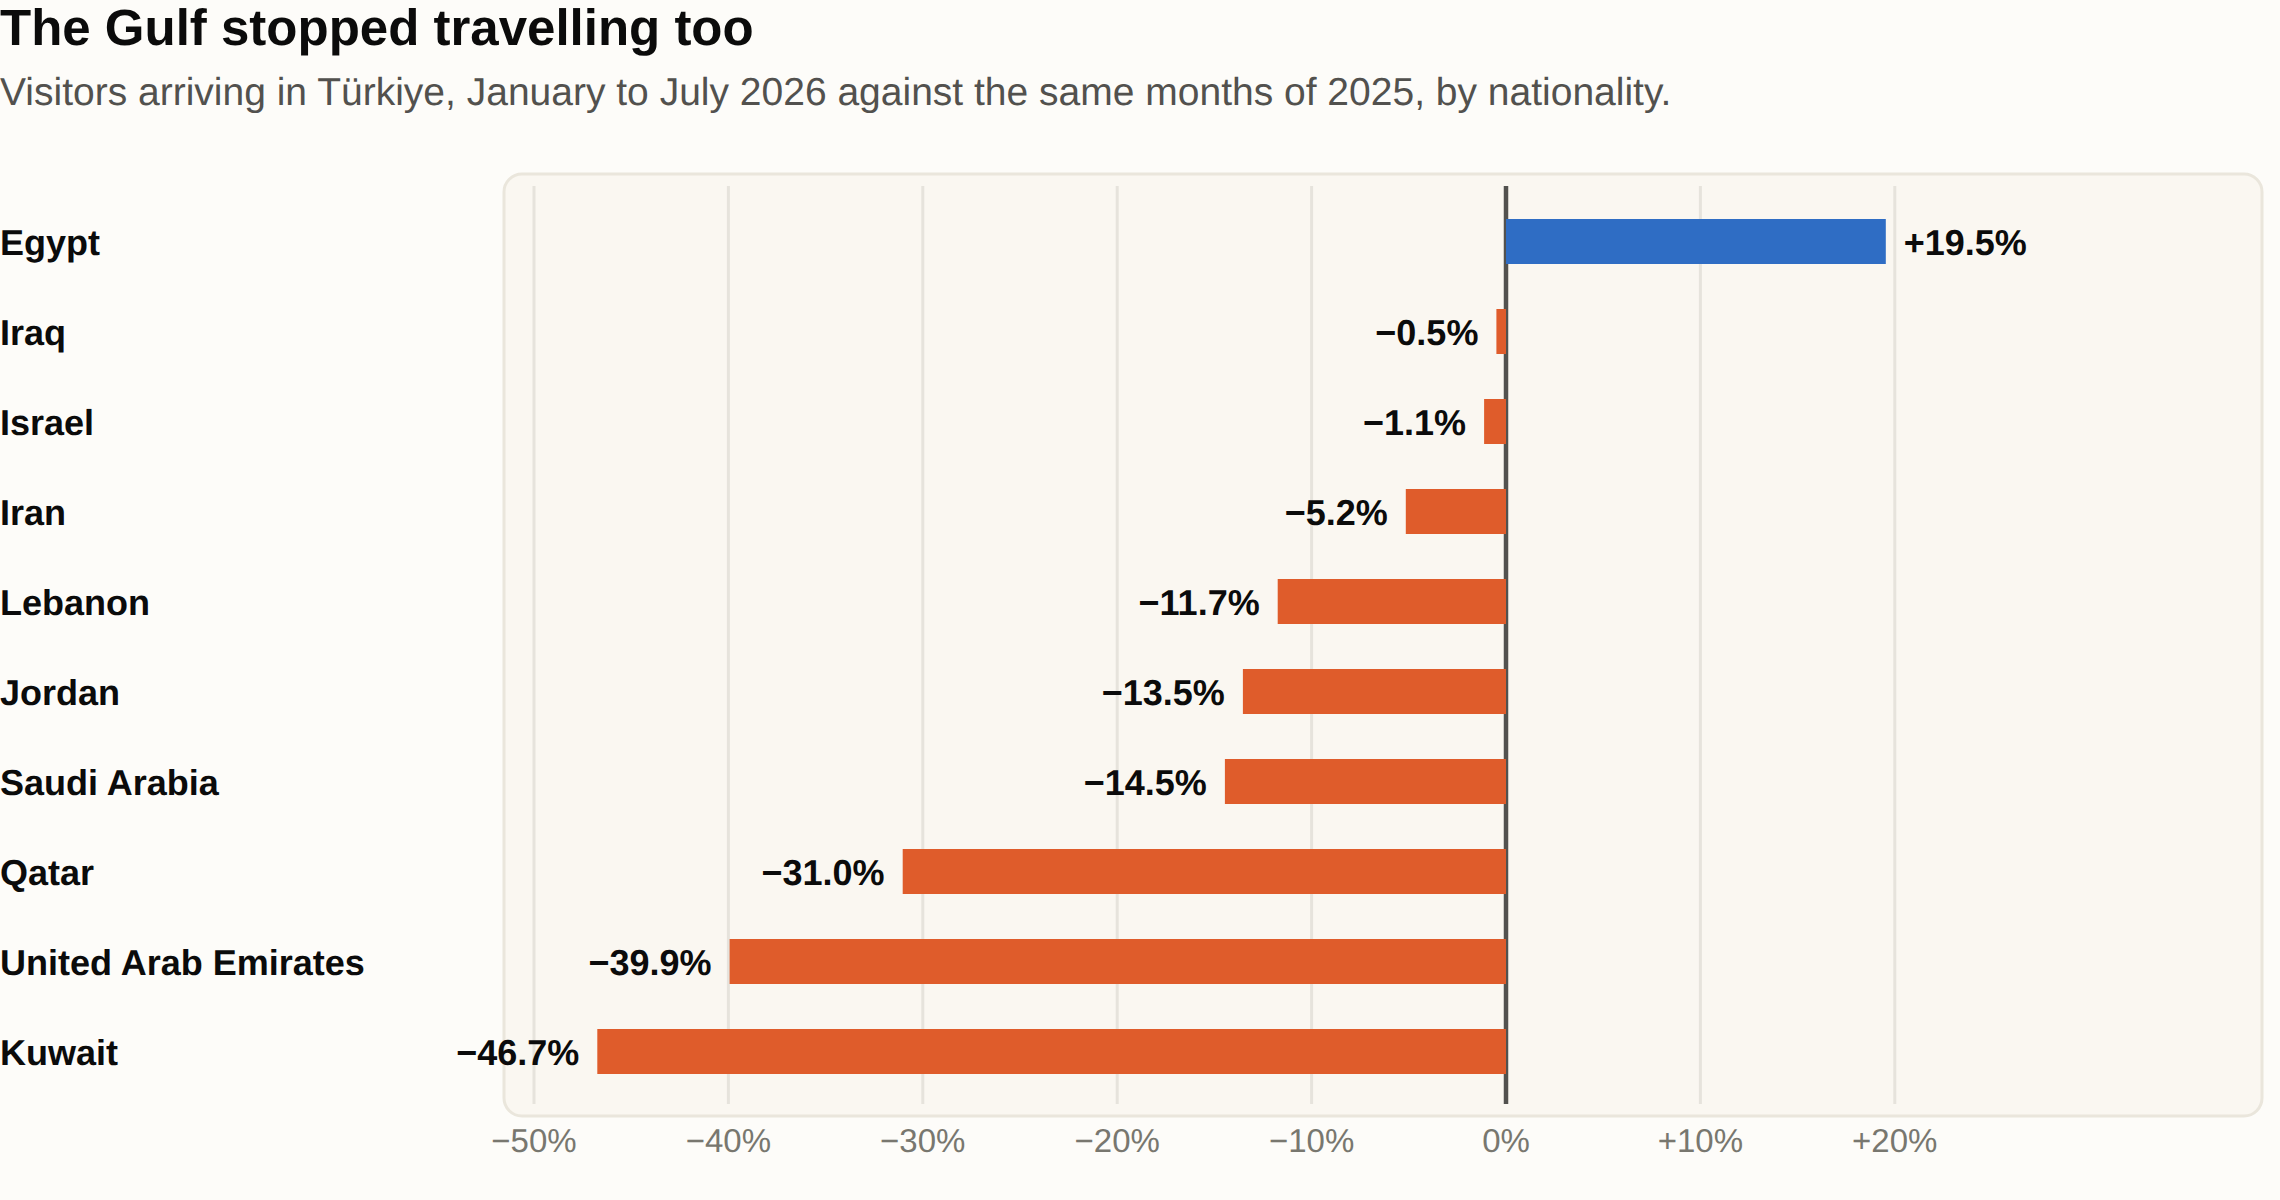
Nothing changed about Türkiye for Kuwaiti, Emirati or Qatari travellers in those seven months. What changed was their own airspace, which was intermittently closed, and the cost and availability of leaving through it. The pattern in the table is consistent with that and not with a change in Türkiye’s appeal. Egyptian arrivals, from a country whose airspace stayed open throughout, rose 19.5 per cent.
Türkiye’s own total, meanwhile, is the quiet finding: 27,863,612 foreign visitors in seven months, down 2.29 per cent. March, the worst month for aviation anywhere in the region, was up 5.01 per cent in Türkiye. April was the trough, at −9.44 per cent. July was −0.27 per cent. A country bordering the affected airspace, which lost 36 per cent of its overflights, finished the first seven months of a regional war essentially level.
What it cost in money
On 7 June 2026, IATA halved its industry profit forecast for the year, from $41 billion to $23.0 billion, against $45 billion in 2025. Net margin falls to 2.0 per cent. Profit per passenger falls to $4.50, from $9.10.
For the region itself:
Source: IATA, 7 June 2026.
An $11.5 billion swing in a single year, in one region, in one industry. And that is only the airlines: it excludes hotels, ground handling, retail, tour operators and everything else that sits downstream of an arriving passenger.
Note the asymmetry in the last two rows. Demand is forecast to fall 11.4 per cent while capacity falls only 4.4 per cent. Aircraft are expensive to park and expensive to un-park, so carriers are flying emptier rather than smaller. IATA’s own comment is that “the immediate recovery path is likely to be driven more by pricing than by a rapid return of volumes”, which, translated, means fares.
Fuel: the cost that reached everyone
The mechanism by which a regional war reaches an airline in Chile is fuel.
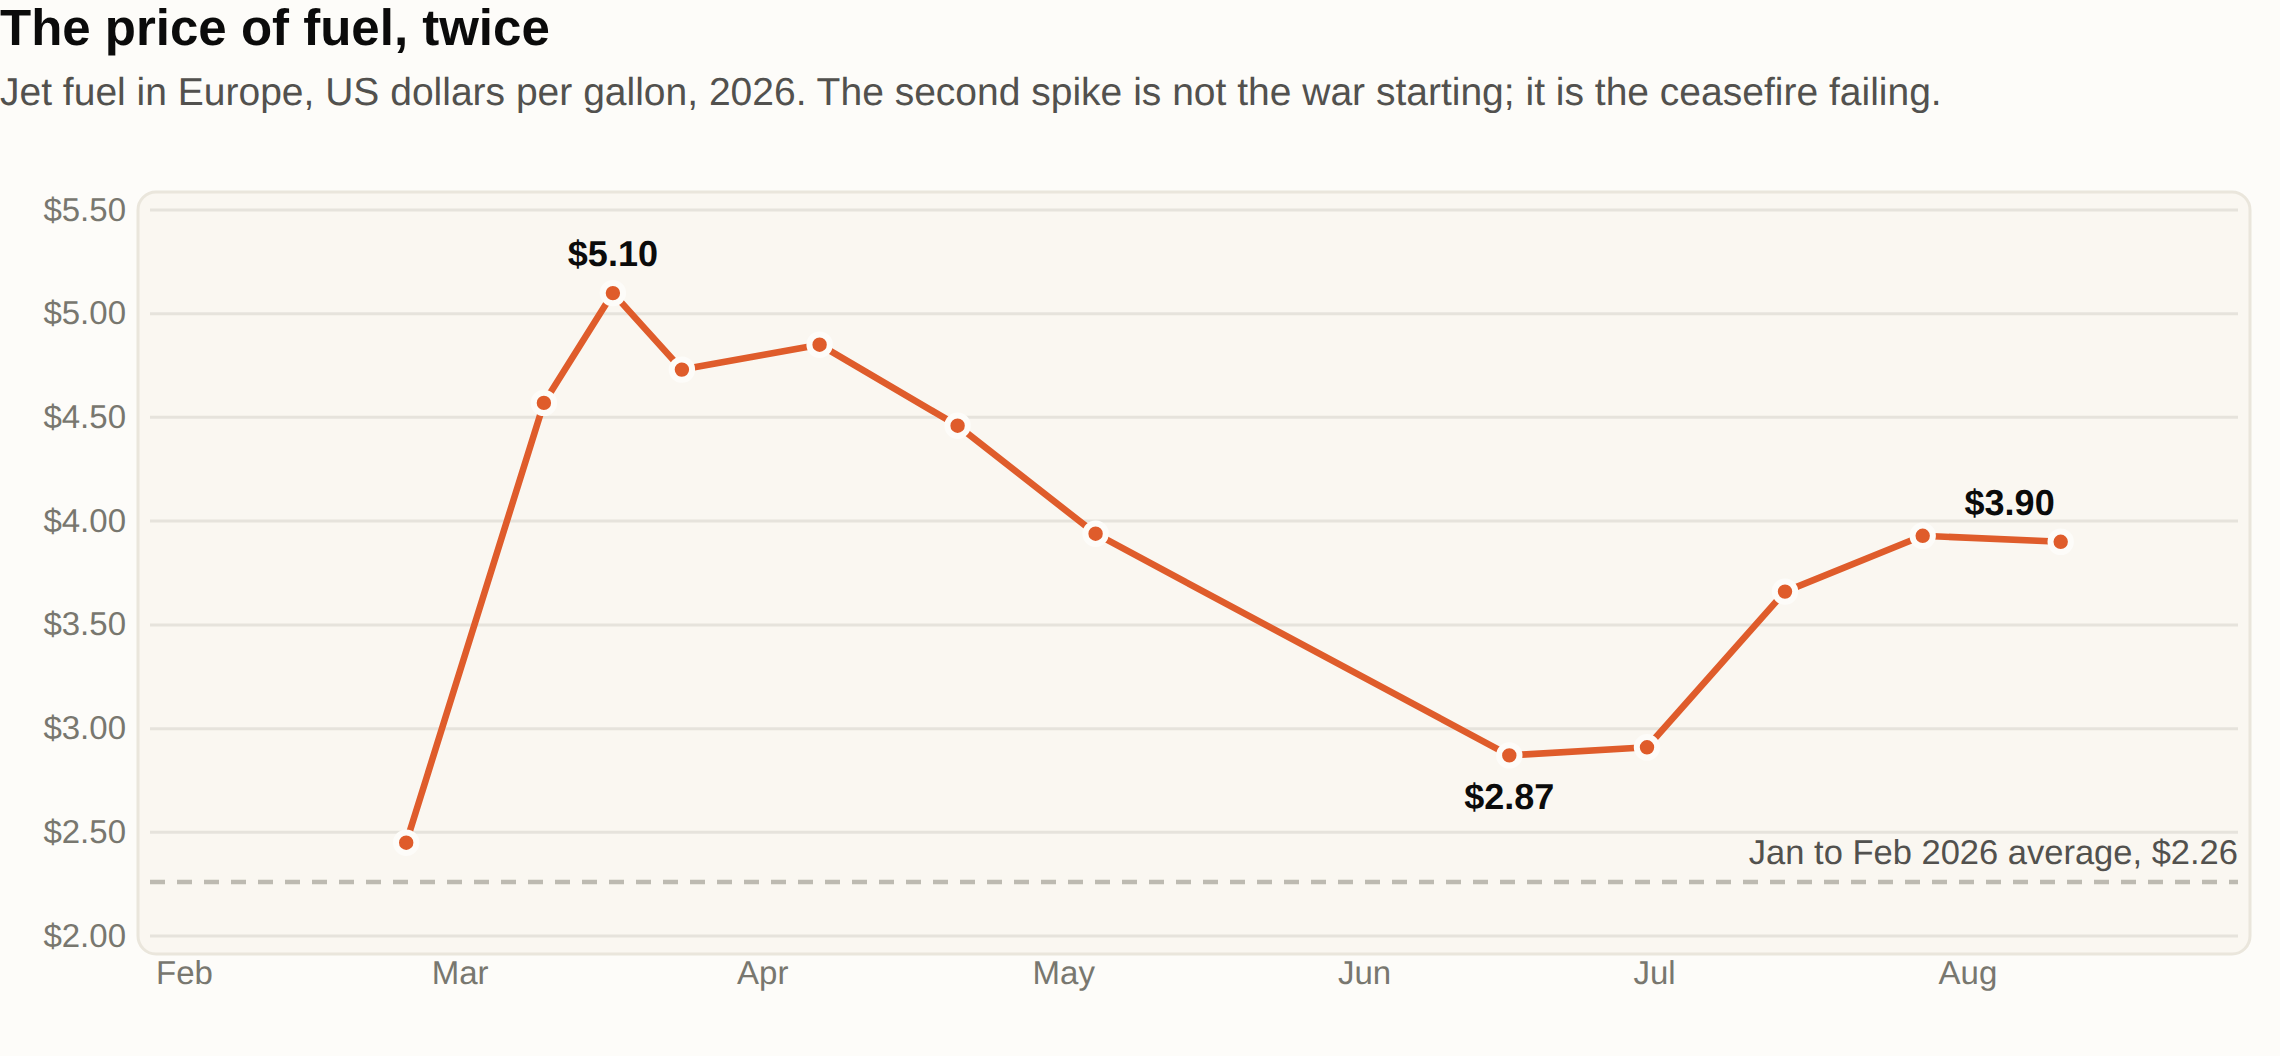
European jet fuel averaged $2.26 a gallon in January and February 2026, and stood at $2.45 on 27 February. On 13 March it was $4.57, an 87 per cent rise in a fortnight and the highest level since 2022. On 20 March it was $5.10. It fell back to $2.87 by 19 June, which EUROCONTROL attributed directly to the reopening of the Strait of Hormuz and the lifting of oil sanctions after the 17 June memorandum. Then it rose again, to $3.66 on 17 July and $3.93 on 31 July, and stood at $3.90 on 14 August, still 73 per cent above the pre-crisis average.
IATA’s full-year assumptions, published in June, are Brent at $95 a barrel against $69 in 2025, and jet fuel at $152 a barrel against $90. The crack spread, the premium of jet fuel over crude, is forecast to average $57 a barrel, which IATA calls a historic high. The industry’s fuel bill rises from $252 billion to $350 billion on unchanged consumption of 104 billion gallons. Fuel goes from 25.4 per cent of operating costs to 31.4 per cent.
The passenger-facing consequence has been estimated but not, so far as we can find, published by any statistical body. Oxford Economics, in work reported in April 2026, put the expected rise in base airfares at 5 to 10 per cent, with the largest increases on long-haul. We report that as a consultancy forecast carried by a news outlet, which is what it is.
The recovery is not a line
The most common error in reading this event is to treat the improvement from March to July as a trend. It is not. It is a sequence of policy events, and it has already reversed once.
Sources: EUROCONTROL fortnightly overviews and Aviation Trends Issue 11; EASA Conflict Zone Information Bulletins; US Virtual Embassy Iran security alert of 21 April 2026; UK House of Commons Library briefing CBP-10637 on the June memorandum.
The single most useful sentence published about this recovery is EUROCONTROL’s, in the week of 13 to 19 July: “The early signs of a recovery in traffic between Europe and the Middle East, which followed the US-Iran Agreement signed on 17 June, lost momentum after the agreement broke down in mid-July.”
By the fortnight of 10 to 16 August, the corridor was 2 per cent below 2025 and EUROCONTROL noted that Europe-Middle East growth had outpaced Europe-North Africa “for the first time since the start of the Middle East crisis”. That is genuine progress. It is also 2 per cent below a 2025 that was itself a normal year, six months after the shock, with restrictions still in force and the governing memorandum expired.
How long these things take
Here the historical record is unusually informative, because tourism shocks are common enough and well enough measured that we can put a range on the recovery rather than guess at it.
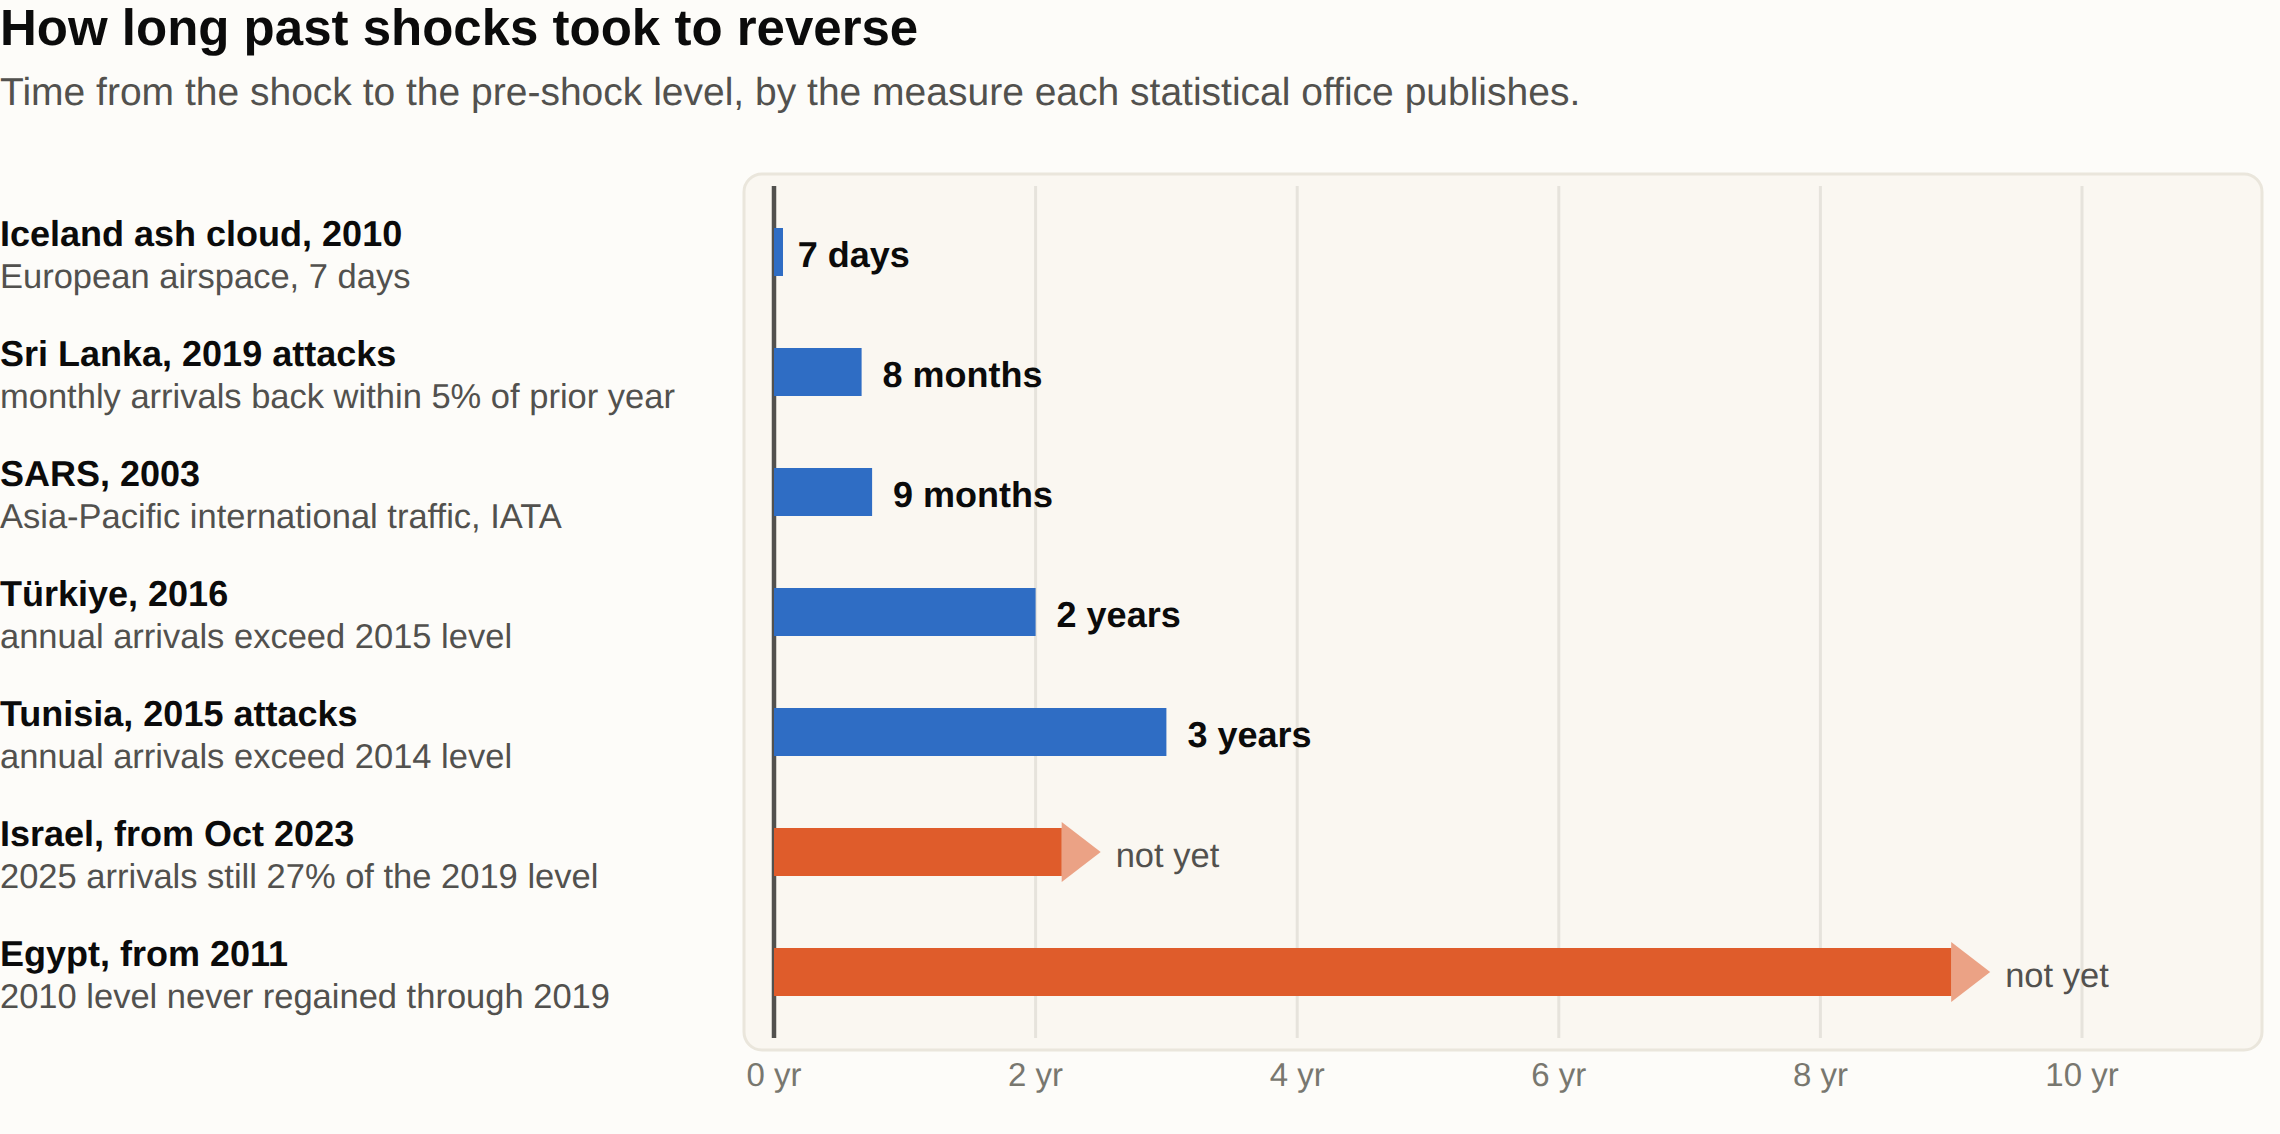
Seven days: the Icelandic ash cloud, 2010. IATA’s own economic briefing records over 100,000 flights cancelled, some 19,000 a day at the peak on 18 to 19 April, more than 1.2 million scheduled passengers affected daily, nearly 30 per cent of worldwide passenger capacity grounded, and $1.7 billion of lost revenue. Then it ended, and traffic resumed. It is the purest example of a shock with no recovery tail at all, and it is here as a contrast rather than a comparator.
Nine months: SARS, 2003. IATA’s retrospective is precise: at the peak in May 2003, Asia-Pacific carriers’ monthly RPKs were “c.35% lower than their pre-crisis levels”, and “monthly international passenger traffic returned to its pre-crisis level within nine months”. Full-year cost: 8 per cent of annual RPKs and $6 billion. That is the closest aviation analogue to the current event, and the current shock was nearly twice as deep: 60.8 per cent off Middle Eastern carriers’ international traffic in March 2026. Its first five months of decay have been faster than the equivalent period after SARS. Whether it returns to baseline as quickly is not yet knowable. Five months in, the region was still 10 per cent below where it was a year earlier, and SARS’s nine-month benchmark measures a return to the pre-crisis level, which is a different and harder test.
Eight months: Sri Lanka, 2019. The Easter Sunday attacks of 21 April 2019 took monthly arrivals down 70.8 per cent in May. By December they were 4.5 per cent below the prior year. The Sri Lanka Tourism Development Authority’s own verdict, in its annual report, is worth quoting because statistical offices rarely editorialise: “a fast recovery of the tourism industry, which can be calculated in months and not years.”
Two to three years: Türkiye and Tunisia. Turkish arrivals fell about 25 per cent in 2016 and exceeded the pre-shock 2015 level in 2018. Tunisian arrivals fell 25.2 per cent in 2015 after the Bardo and Sousse attacks and did not clearly exceed the pre-shock 2014 level until 2018; tourism receipts in dinars, per the Office National du Tourisme Tunisien’s own tables, took until 2018 as well.
Longer than a decade: Egypt. This is the cautionary case.
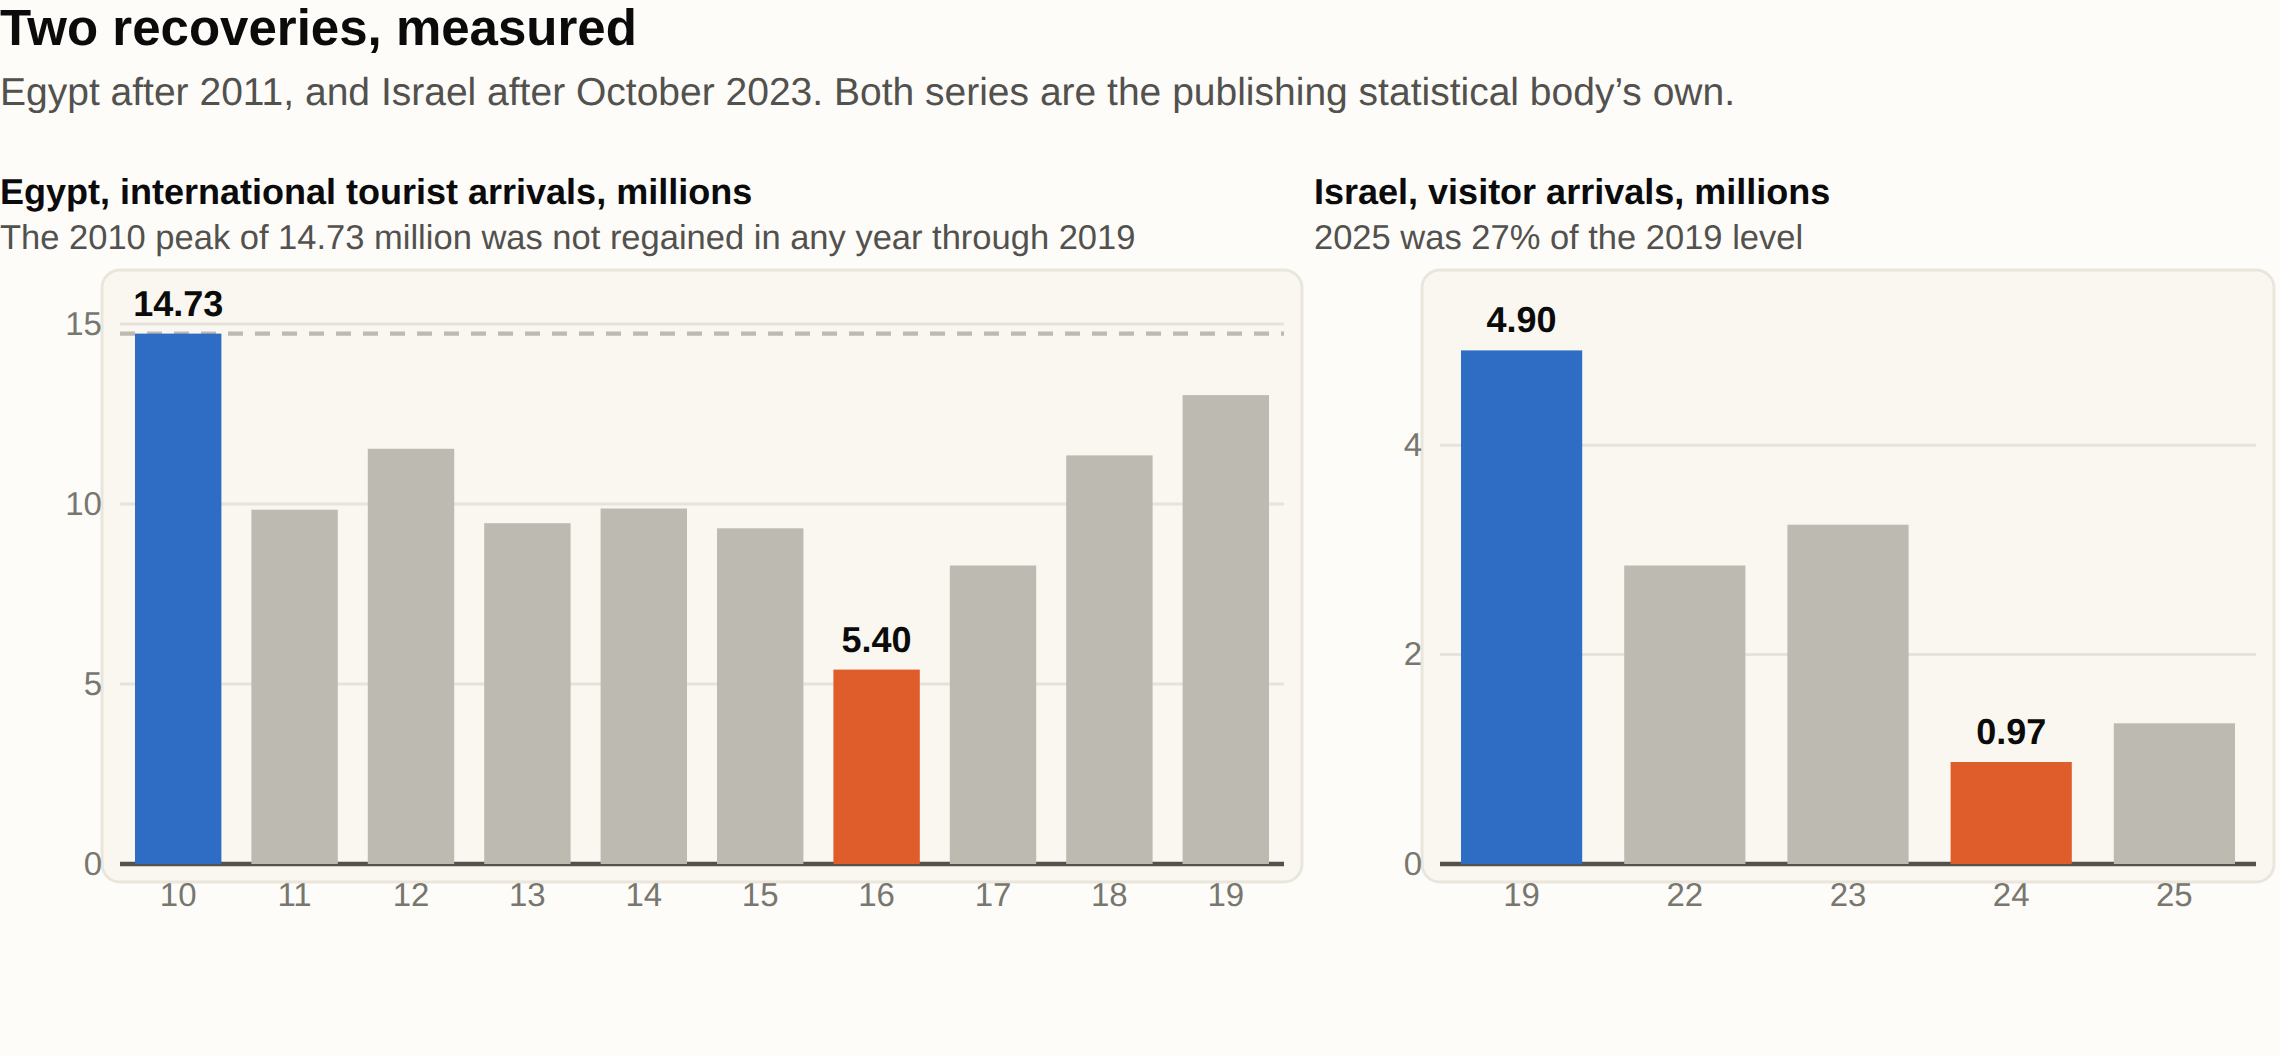
Egyptian arrivals peaked at 14,731,000 in 2010. They fell to 9,845,000 in 2011, recovered partially, fell again to 9,464,000 in 2013, and then collapsed to 5,399,000 in 2016, 63 per cent below 2010, after the October 2015 Metrojet crash and the flight suspensions that followed. Russian flights to Egyptian resorts, cut in October 2015, did not resume until August 2021: nearly six years. Egypt then recovered strongly, reaching 13,026,000 in 2019.
It never regained 2010. Not in 2017, not in 2018, not in 2019. Nine years, and the line was still 11.6 per cent short when the next global disruption arrived.
Still unfinished: Israel, from October 2023. The Central Bureau of Statistics publishes the whole arc in one table. Visitor arrivals were 4,904,600 in 2019 and 3,239,100 in 2023. In 2024 they were 974,400, down 69.9 per cent. In 2025 they were 1,342,900, up 37.8 per cent, and still 27 per cent of the 2019 level. That is the position two years and two months after the shock, on the latest full year of data.
The pattern across all seven cases is consistent, and it is not the pattern most coverage implies. The depth of the shock is a poor predictor of the length of the recovery. Sri Lanka’s monthly collapse was steeper than Tunisia’s annual one and it recovered three to four times faster. What predicts the tail is whether the underlying condition ends. A one-off event with no continuing restriction recovers in quarters. A situation that keeps generating flight suspensions, advisories and airspace bulletins recovers in years.
The depth of the shock is a poor predictor of the length of the recovery. What predicts the tail is whether the underlying condition ends.
On that test, the current event is ambiguous. Its aviation decay has been fast, faster than SARS. But the memorandum that produced the June rebound collapsed in July and expired in August, five conflict-zone bulletins remain in force, and major carriers have cancellations booked well past the end of the year.
What the data does not tell you
Three cautions, in the spirit of the audit we published last week [INTERNAL LINK: the Tourism Data Blackout article, once its URL exists].
Almost every figure here is provisional. UN Tourism marks its entire 2026 arrivals table provisional. IATA states on every release that its figures are provisional and that historic data is subject to revision. Türkiye’s border bulletin is provisional, and so is Israel’s current-year table. None of these labels is prominent; most are a footnote below a table. Quote the edition and its date, not just the organisation. The August instalment of this series found UN Tourism restating every year from 2020 to 2025 between two editions of the same publication six months apart.
Watch which series you are quoting. IATA publishes both a total-market and an international series for every region, and for the Middle East in 2026 they diverge by up to 2.2 percentage points, in March. This article uses the total-market series throughout. Jordan offers a sharper version of the same trap: its Ministry of Tourism reports arrivals down 5 per cent for January to April, while a separate ministry series covering visits to ticketed tourist sites over a near-identical window, reported by the Jordan Times, is down 29 per cent. Both are real. They count different things. Combining them would produce a number that describes nothing.
And the reporting itself thinned out exactly when it mattered. Etihad published monthly traffic statistics through February 2026, the last full month before the war, and we can find none since. Hamad International Airport’s most recent traffic release is for the third quarter of 2025. Dubai’s Department of Economy and Tourism has a January 2026 performance report and no visible successor. Jordan’s Ministry of Tourism quarterly review stops at the first quarter of 2025. Qatar Tourism published a Q1 2026 visitor figure through the state news agency, but its own reports page carries nothing later than the 2025 annual.
The two UAE hubs illustrate how much the choice of disclosure shapes the record. Dubai Airports published a half-year statement carrying the 31.3 per cent decline in its opening lines. Abu Dhabi Airports published a July release reporting average daily volumes above the same period of 2025, without an absolute total and without reference to the conflict or the airspace. Both are accurate. Read side by side, they describe two different years.
We cannot say why any of these series stopped, and we are not suggesting anything was withheld. The effect, though, is straightforward: the public record of this event will be thinner than the public record of the growth that preceded it, and much of what does exist arrived through state news agencies rather than through the statistical releases that normally carry it.
What this actually means for travellers and planners
For anyone with a trip to the region in the next few months, the useful summary is that the disruption is operational, not administrative.
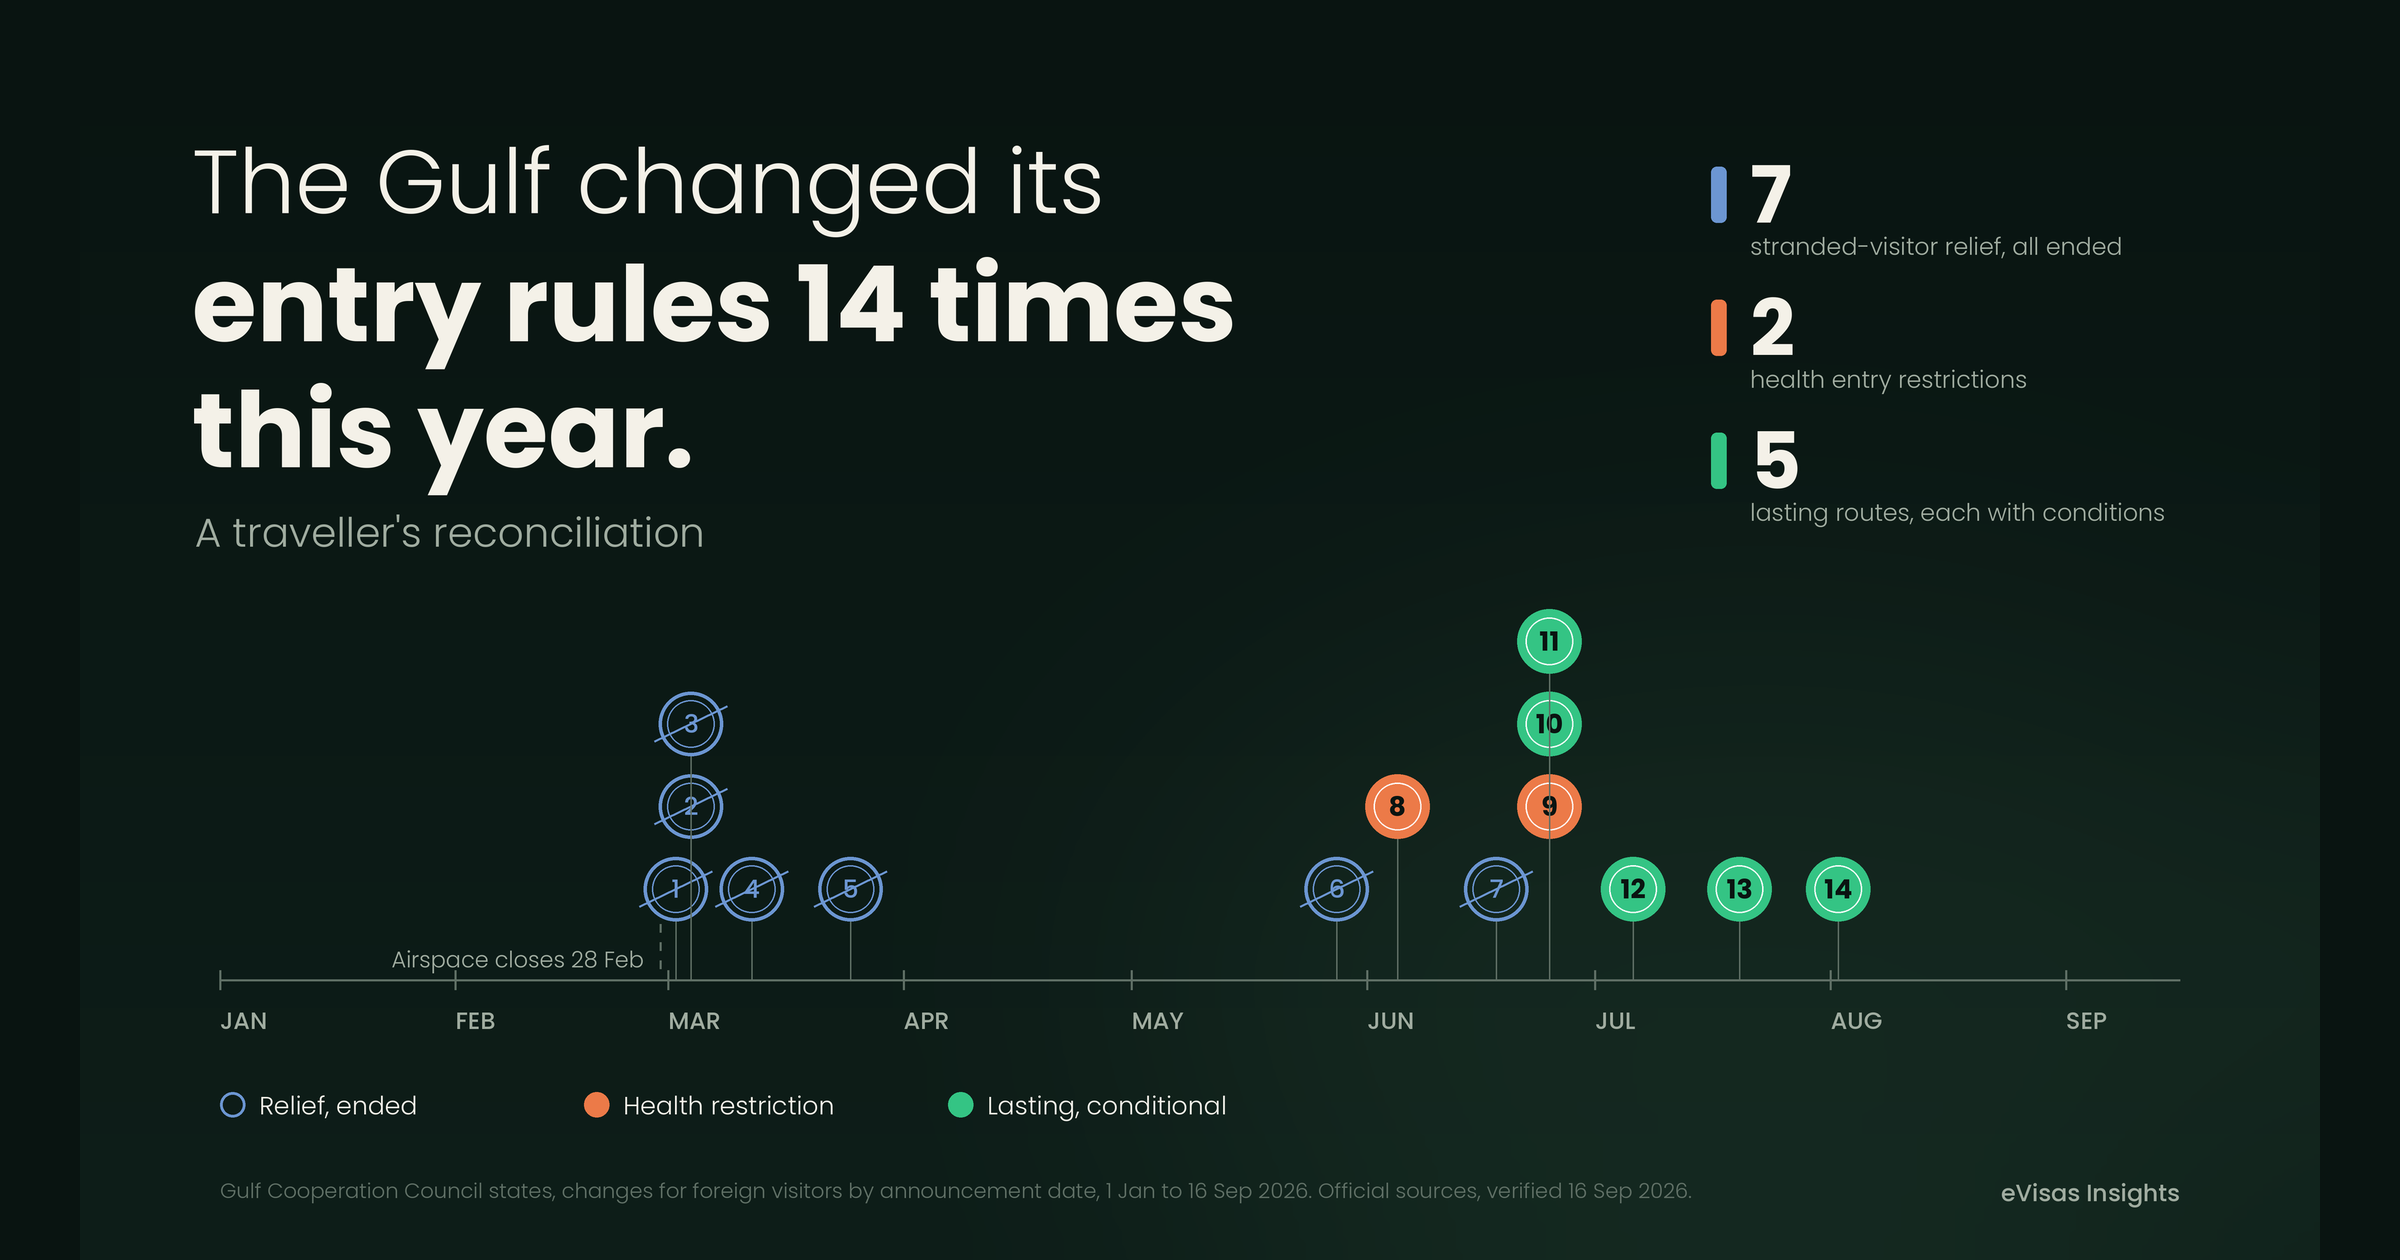
Entry systems mostly did not change. What changed was flights. Airspace closed, airlines suspended routes, aircraft re-routed, and fares rose because fuel did. Those are three different clocks and they are not synchronised. As at 31 August 2026, EASA’s bulletins covering Iran, Iraq, Lebanon, the Persian Gulf and Gulf of Oman, and Jordan all run to at least 30 September. Several major European and Asian carriers have Gulf cancellations booked to late October 2026, and one to March 2027.
Some practical consequences follow.
Check the flight before the visa. In a normal year, the authorisation is the uncertain part of a trip and the flight is the certainty. That is currently reversed. A valid entry permit is no use if the route is suspended.
Read advisories alongside the schedule. A government travel advisory is a statement of policy, updated on its own cycle. It is not a real-time observation of which flights are operating. Both are worth checking, and they will not always agree.
Assume every rule you check has a date on it. Some Gulf states adjusted procedures during the closures. Anything you read that does not say when it was last verified should be treated as undated.
Do not extrapolate the regional number to your destination. As the figures above show, “the Middle East is down 14 per cent” tells you nothing useful about Egypt, which is up, or about the pilgrimage traffic into Saudi Arabia, which grew.
Where we come into this
eVisas.com is a private visa assistance service, not a government body, and nothing we do changes an entry decision. Governments issue visas and governments refuse them. What we do is narrower: we maintain dated entry-requirement information for the destinations we cover, check applications against the current published rules before they are submitted, and tell applicants what has changed since they last looked.
If you are travelling in the region, the pages that matter are the United Arab Emirates, Saudi Arabia, Oman, Bahrain, Jordan and Egypt. Each carries the current requirement, the date it was last verified, and the government source it came from. Where the position has moved this year, the page says so rather than quietly updating.
Methodology and source notes
Every figure in this article was read against its primary source between 25 August and 1 September 2026, and each source is named in the text. No figure here is an estimate produced by us. Where we have subtracted one published figure from another, namely the global drag in Chart 2 and the percentage changes in the Turkish nationality table, the text says so at that point.
The two anchor series. UN Tourism’s regional and monthly arrivals figures come from the World Tourism Barometer, Volume 24 Issue 2, May 2026, as revised in July 2026, in the free public excerpt. IATA’s monthly figures come from its press releases of 29 April, 28 May, 30 June, 30 July and 31 August 2026 and the Air Passenger Market Analysis reports published alongside them. IATA publishes both a total-market and an international series by region; this article uses total market throughout except where it says otherwise, and IATA’s Middle East share of global RPK, 9.5 per cent, is its own stated 2025 base-year figure.
The flight and fuel data comes from EUROCONTROL: European Aviation Trends Issue 11 of 31 March 2026 for the closure timeline and the re-routing estimates, and the fortnightly European Aviation Overview for weekly corridor volumes and jet fuel prices. In 2026 EUROCONTROL publishes this overview on odd-numbered weeks only, so the series in Chart 1 is fortnightly by construction, not by selection. Two of its own editions describe the wartime jet fuel peak slightly differently, at $5.10 on 20 March in one and “$5.01 in early April” in another, so Chart 5 plots only the dated fortnightly readings.
The airspace timeline comes from EASA’s Conflict Zone Information Bulletin register, which records issue dates, revisions, expiry dates and the flight information regions covered. The 17 June instrument is the Islamabad Memorandum of Understanding, a fourteen-point memorandum with a sixty-day term; EUROCONTROL refers to it as the “US-Iran Agreement”. It expired on 16 August 2026 without extension.
Country figures are national statistics offices and tourism ministries wherever those bodies publish, and are attributed individually in the text. Where the figure reached us through a news outlet rather than the publisher’s own page, which in this region is common because several bodies release only through a state news agency, both are named. The full list is in the verification log above.
Historical comparators use each country’s own statistical authority where it is still online: the Sri Lanka Tourism Development Authority, the Turkish Ministry of Culture and Tourism, the Office National du Tourisme Tunisien and Israel’s Central Bureau of Statistics. For Egypt and Tunisia’s longer annual series we use the World Bank’s ST.INT.ARVL indicator, which the World Bank compiles from UN Tourism; the Tunisian values in that series match the national tourism office’s own published table to the unit, which is why we treat the Egyptian values from the same series as sound.
One thing we deliberately did not do. EUROCONTROL publishes 602 tonnes of additional daily fuel burn, and IATA publishes a jet fuel price. Multiplying them would produce an attention-getting daily dollar figure for the cost of the re-routing. It would also be our number, not anyone’s published finding, and it would ignore hedging, contract pricing and regional differentials. No institution has published a monetised cost of the closures, and this article does not invent one.
Frequently asked questions
How much did Middle East tourism fall in 2026?
International tourist arrivals to the Middle East fell 14 per cent in the first quarter of 2026, according to UN Tourism’s May 2026 World Tourism Barometer as revised in July. It was the only world region to decline; global arrivals rose 2 per cent over the same quarter. In March alone, the regional decline was 37 per cent.
How badly was air travel affected?
Middle Eastern carriers’ passenger traffic fell 58.6 per cent in March 2026 against March 2025 on IATA’s total-market measure, and 60.8 per cent on its international measure. The decline narrowed each month afterwards: 46.6 per cent in April, 28.4 per cent in May, 13.9 per cent in June and 10.0 per cent in July. Year to date through July, the region was down 21.1 per cent.
Did the conflict affect global tourism and aviation?
Yes, measurably. UN Tourism cut its 2026 global growth forecast from 3 to 4 per cent to 1 to 3 per cent, attributing a reduction of 1 to 2 percentage points to the conflict. In aviation the effect is readable directly from IATA’s figures: global demand fell 3.4 per cent in April but rose 1.2 per cent excluding Middle Eastern carriers, a gap of 4.6 percentage points. That gap had narrowed to 1.0 point by July.
Which Middle East destinations were worst affected?
Air hubs. Dubai International handled 31.5 million passengers in the first half of 2026, down 31.3 per cent. Qatar’s monthly visitor numbers fell from 646,000 in January to 63,000 in March. Destinations reached overland or outside the closed airspace held up far better: Türkiye was down 2.29 per cent across seven months and Egypt was up 7 per cent across four.
Was Egypt affected?
Less than its neighbours, and in the opposite direction overall. Egyptian government figures show 6.1 million arrivals from January to April 2026, up 7 per cent, and UN Tourism recorded Egypt up 16 per cent in the first quarter. Egypt kept its airspace open. Its tourism minister has said April alone was down 16 per cent.
Did the Hajj go ahead in 2026?
Yes. Saudi Arabia’s General Authority for Statistics recorded 1,707,301 pilgrims for Hajj 1447 AH, up 2.0 per cent on the previous year, of whom 1,546,655 came from outside the Kingdom and 1,485,729 arrived by air.
Are Middle East airspaces open now?
Partially, and the position changes. As at 31 August 2026, EASA had five conflict-zone bulletins in force covering Iran, Iraq, Lebanon, the Persian Gulf and Gulf of Oman, and Jordan, all extended to 30 September 2026. Iranian airspace partially reopened on 21 April 2026. Anyone flying should check their airline’s current schedule rather than any general statement, including this one.
Have air fares gone up?
Jet fuel is the main channel. IATA’s 2026 assumption is $152 a barrel against $90 in 2025, lifting the industry’s fuel bill from $252 billion to $350 billion. Oxford Economics, in work reported in April 2026, expected base fares to rise 5 to 10 per cent, with the largest increases on long-haul. No statistical body has published an observed fare increase attributable to the conflict.
How long will the recovery take?
The historical range is wide and it depends on whether the underlying condition ends rather than on how deep the fall was. Asia-Pacific traffic returned to pre-crisis levels nine months after SARS. Sri Lankan arrivals were within 5 per cent of the prior year eight months after the 2019 attacks. Turkish and Tunisian arrivals took two to three years. Egyptian arrivals never regained their 2010 peak in the nine years that followed, and Israeli arrivals in 2025 were still 27 per cent of the 2019 level.
Do I still need a visa for these countries?
Entry requirements are set by each government and are largely unchanged by the conflict; what changed is flights and airspace. Requirements do vary by nationality and can be amended at short notice, so check the current position for your passport and destination, and note the date on whatever you read.
Conclusion
The measured answer to the question in the title, for this conflict and this region, is: about a third of an air hub’s traffic, roughly one in seven regional tourist arrivals, an $11.5 billion swing in airline profitability, and just under six percentage points off global aviation growth in the worst month.
The more useful finding is the shape rather than the size. This shock arrived in two hours, and on the aviation measure it has faded faster over five months than any comparable event we could find, including SARS. The recovery on that measure is real, and it is largely a story about how quickly airlines re-route when there is somewhere to re-route to.
But three things sit against it. The recovery has already reversed once, in July, and the agreement that produced it expired in August. The tourism recovery lags the aviation recovery, because aircraft come back before confidence does. Israel is more than two years into that lag and about a quarter of the way home. And the countries that gained, Egypt and Türkiye among them, gained precisely what the countries that lost gave up, which means the regional total understates the redistribution enormously.
For the reader with a practical decision to make, the operational summary is short. The rules for entering these countries have mostly not changed. The flights have. Check the schedule first, check the entry requirement second, and check the date on both. In a year when a corridor carrying two thousand flights a day went to three hundred and seventy-three in forty-eight hours, and back to within 2 per cent of normal in six months, the most dangerous piece of information is the one that was accurate in March.
We date every entry requirement we publish, and we say where it came from. That was a discipline before this year. It is a necessity now.
Sources, all checked between 25 August and 1 September 2026. UN Tourism, World Tourism Barometer, Volume 24 Issue 2, May 2026 as revised July 2026 (excerpt and presentation editions). IATA press releases of 29 April, 28 May, 30 June, 30 July and 31 August 2026, and the accompanying Air Passenger Market Analysis reports for March to July 2026. IATA, “Middle East Disruptions and High Fuel Prices Halve Airline Industry Profitability”, 7 June 2026. IATA economic briefings, The impact of the ash plume (2010) and What can we learn from past pandemic episodes (SARS, 2003). EUROCONTROL, European Aviation Trends Issue 11, 31 March 2026. EUROCONTROL, European Aviation Overview, odd-numbered weeks 9 to 33 of 2026. EUROCONTROL en-route charges monthly data, March to July 2026. EASA, Conflict Zone Information Bulletin register, bulletins 2026-03 to 2026-08, and the revised advisory note of 8 July 2026. Dubai Airports, half-year 2026 traffic statement, 26 August 2026. Emirates Group, annual report for the year ended 31 March 2026. Qatar Tourism figures as published by Qatar News Agency, 28 June 2026. Saudi General Authority for Statistics, Hajj statistics bulletins for 1446 AH and 1447 AH. Saudi Ministry of Tourism first-quarter 2026 data as released through the Saudi Press Agency. Republic of Türkiye Ministry of Culture and Tourism, monthly border statistics bulletin, July 2026. Oman National Centre for Statistics and Information hotel statistics, first half 2026. Jordan Ministry of Tourism and Antiquities and Central Bank of Jordan, January to April 2026. Egyptian Cabinet tourism figures of 28 May 2026, as reported by Ahram Online. Dubai Airports interview material, The National, 26 August 2026. Gulf Business, Calcalist, Zawya, the Jordan Times, the Oman Observer and the Oman News Agency, in each case reporting figures attributed to the national body named in the text. Israel Central Bureau of Statistics, Tourism and Hotel Services Statistics Quarterly, Volume 54 Number 1, April 2026. Sri Lanka Tourism Development Authority, Annual Statistical Report 2019 and Annual Report 2019. Office National du Tourisme Tunisien, Le Tourisme Tunisien en Chiffres. World Bank, World Development Indicators, indicator ST.INT.ARVL. UK House of Commons Library, briefing CBP-10637, July 2026. US Virtual Embassy Iran, security alert of 21 April 2026. Oxford Economics forecast on fuel prices and air passenger demand, as reported April 2026.