Spending More, Staying Less: What Happened to the Average International Traveller
 Elena DarziNovember 6, 202620 min read

International tourism took in about 27% more dollars in 2025 than in 2019, from only 4% more travellers. Once you remove inflation, the average trip costs about the same as before the pandemic. Visitors to EU hotels and rentals are staying a little shorter.
The headline numbers suggest a new kind of traveller. UN Tourism estimates that international tourists spent about USD 1.9 trillion in the countries they visited in 2025, up from USD 1.49 trillion in 2019. Over the same period, the number of international arrivals rose from 1.47 billion to 1.52 billion. Divide one by the other and the average arrival is worth about USD 1,248, against USD 1,017 in 2019. That is a 23% rise in six years.
Most of that rise is price. US consumer prices rose about 26% between 2019 and 2025, so in 2019 dollars the average arrival in 2025 was worth about USD 991, slightly less than before the pandemic. UN Tourism’s own measure, which works in each destination’s currency at constant prices, finds a real gain, but a small one: roughly 5 to 6% per arrival.
So travellers are spending more money, but not buying much more trip. And the best large-scale evidence on trip length, Eurostat’s count of nights and arrivals in EU accommodation, shows foreign guests staying 3.31 nights per arrival in 2025, against 3.34 in 2019.
This article lays out the three sources behind those findings, tests them against the two countries that publish per-visitor spending in enough detail (Japan and France), and gives the currency and inflation caveat the prominence it needs. Without it, the analysis does not hold up.
The short answer
Receipts grew faster than arrivals.
Between 2019 and 2025, world international tourism receipts rose about 27% in US dollars. Arrivals rose 3.7% (UN Tourism).
Per-trip spending rose 23% in current dollars.
That is about USD 1,248 per arrival in 2025, against USD 1,017 in 2019.
After inflation, the rise mostly disappears.
In 2019 US dollars, spending per arrival is down 2.6%. On UN Tourism’s constant-price, local-currency basis, it is up about 5 to 6%.
Stays are slightly shorter in Europe.
Non-resident guests in EU accommodation averaged 3.31 nights per arrival in 2025, against 3.34 in 2019, a fall of 0.9% (Eurostat).
Country results depend on the ruler.
Spending per visitor to Japan rose 44% in yen but only 5% in dollars. In France, average spend per stay rose 7% in 2025, about 6% after French inflation.
What receipts growing faster than arrivals actually means
Two numbers dominate coverage of world tourism. Arrivals count international overnight visitors as they cross a border. Receipts add up what those visitors spend inside the destination, on accommodation, food, local transport, shopping and entertainment. Receipts exclude the international fare, which UN Tourism counts separately: including passenger transport, total tourism export revenue reached an estimated USD 2.2 trillion in 2025.
When receipts grow faster than arrivals, spending per arrival is rising. UN Tourism said exactly this in January 2026: tourism earnings grew faster than arrivals in many destinations, and inflation in tourism-related services remained above its pre-pandemic average and above headline inflation.
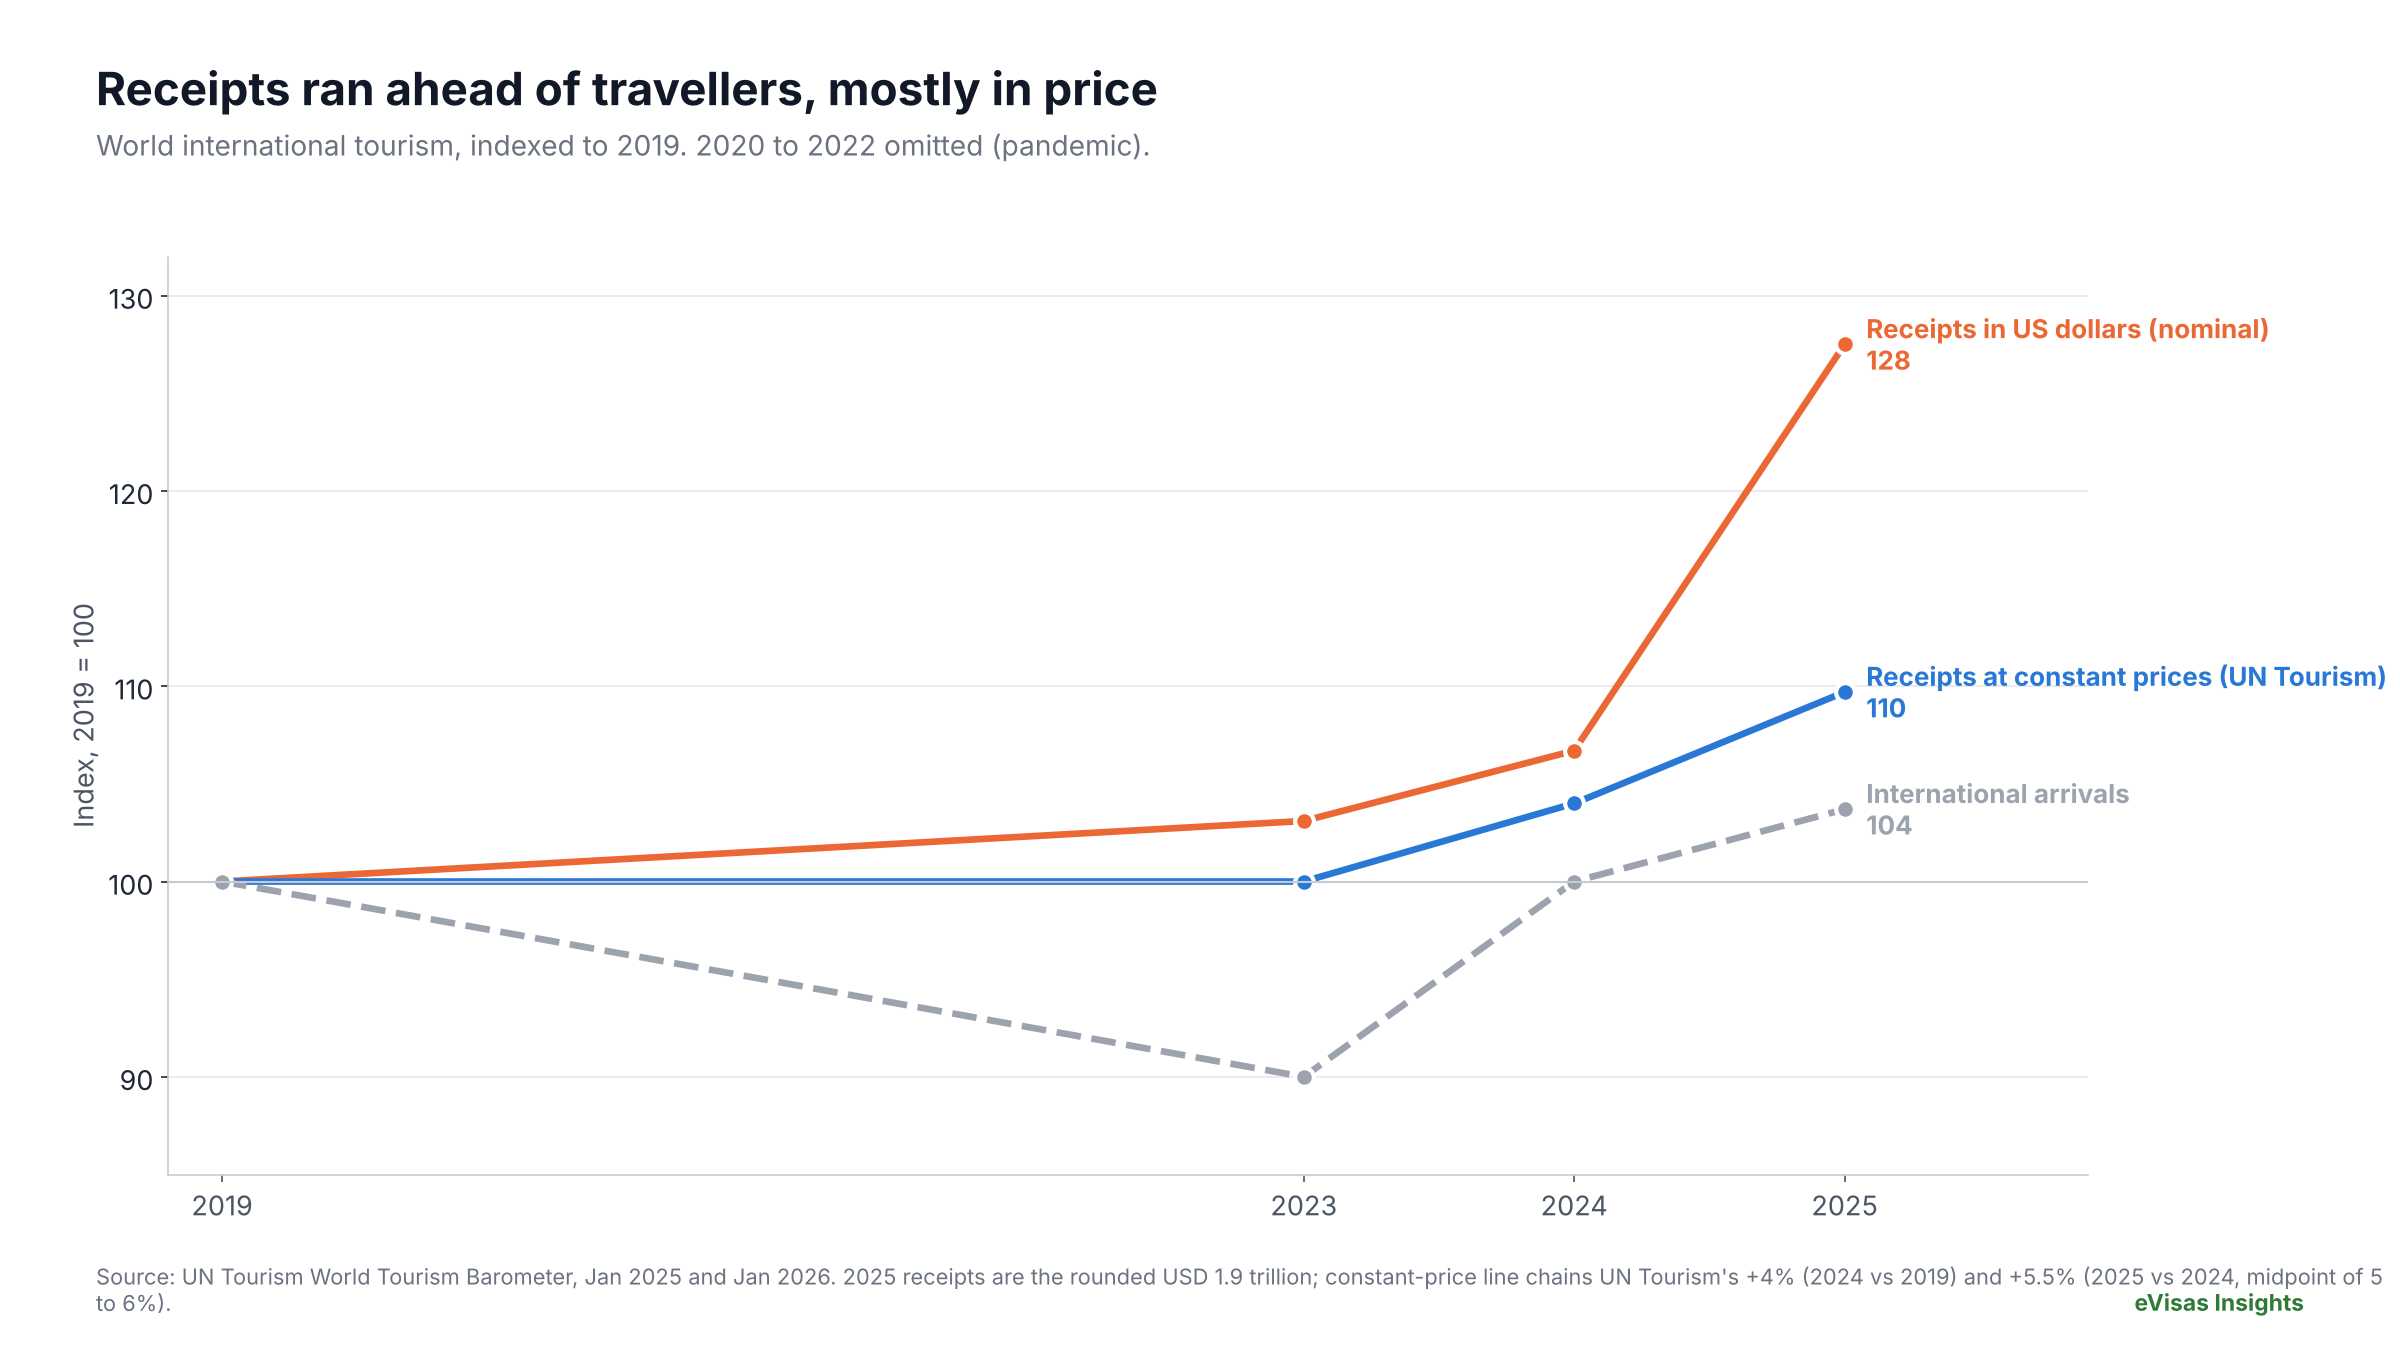
Chart 1. World international tourism indexed to 2019. The orange line is receipts in current US dollars. The blue line chains UN Tourism’s real growth figures (receipts in local currencies at constant prices). The grey line is arrivals. Sources: UN Tourism World Tourism Barometer, January 2025 and January 2026.
The gap between the orange and blue lines is the key to this article. Both describe the same spending. The orange line measures it in dollars of the day, so it includes inflation in the destinations and every movement of the dollar against local currencies. The blue line removes both. By 2025, the orange line stands at 128 and the blue at about 110. Arrivals stand at 104.
In other words, of the 28-point rise in dollar receipts, roughly 18 points are price and currency, about 6 points are extra real spending per traveller, and about 4 points are extra travellers.
The average trip, three ways
The cleanest way to see the effect is to look at one number, spending per arrival, through three different rulers.
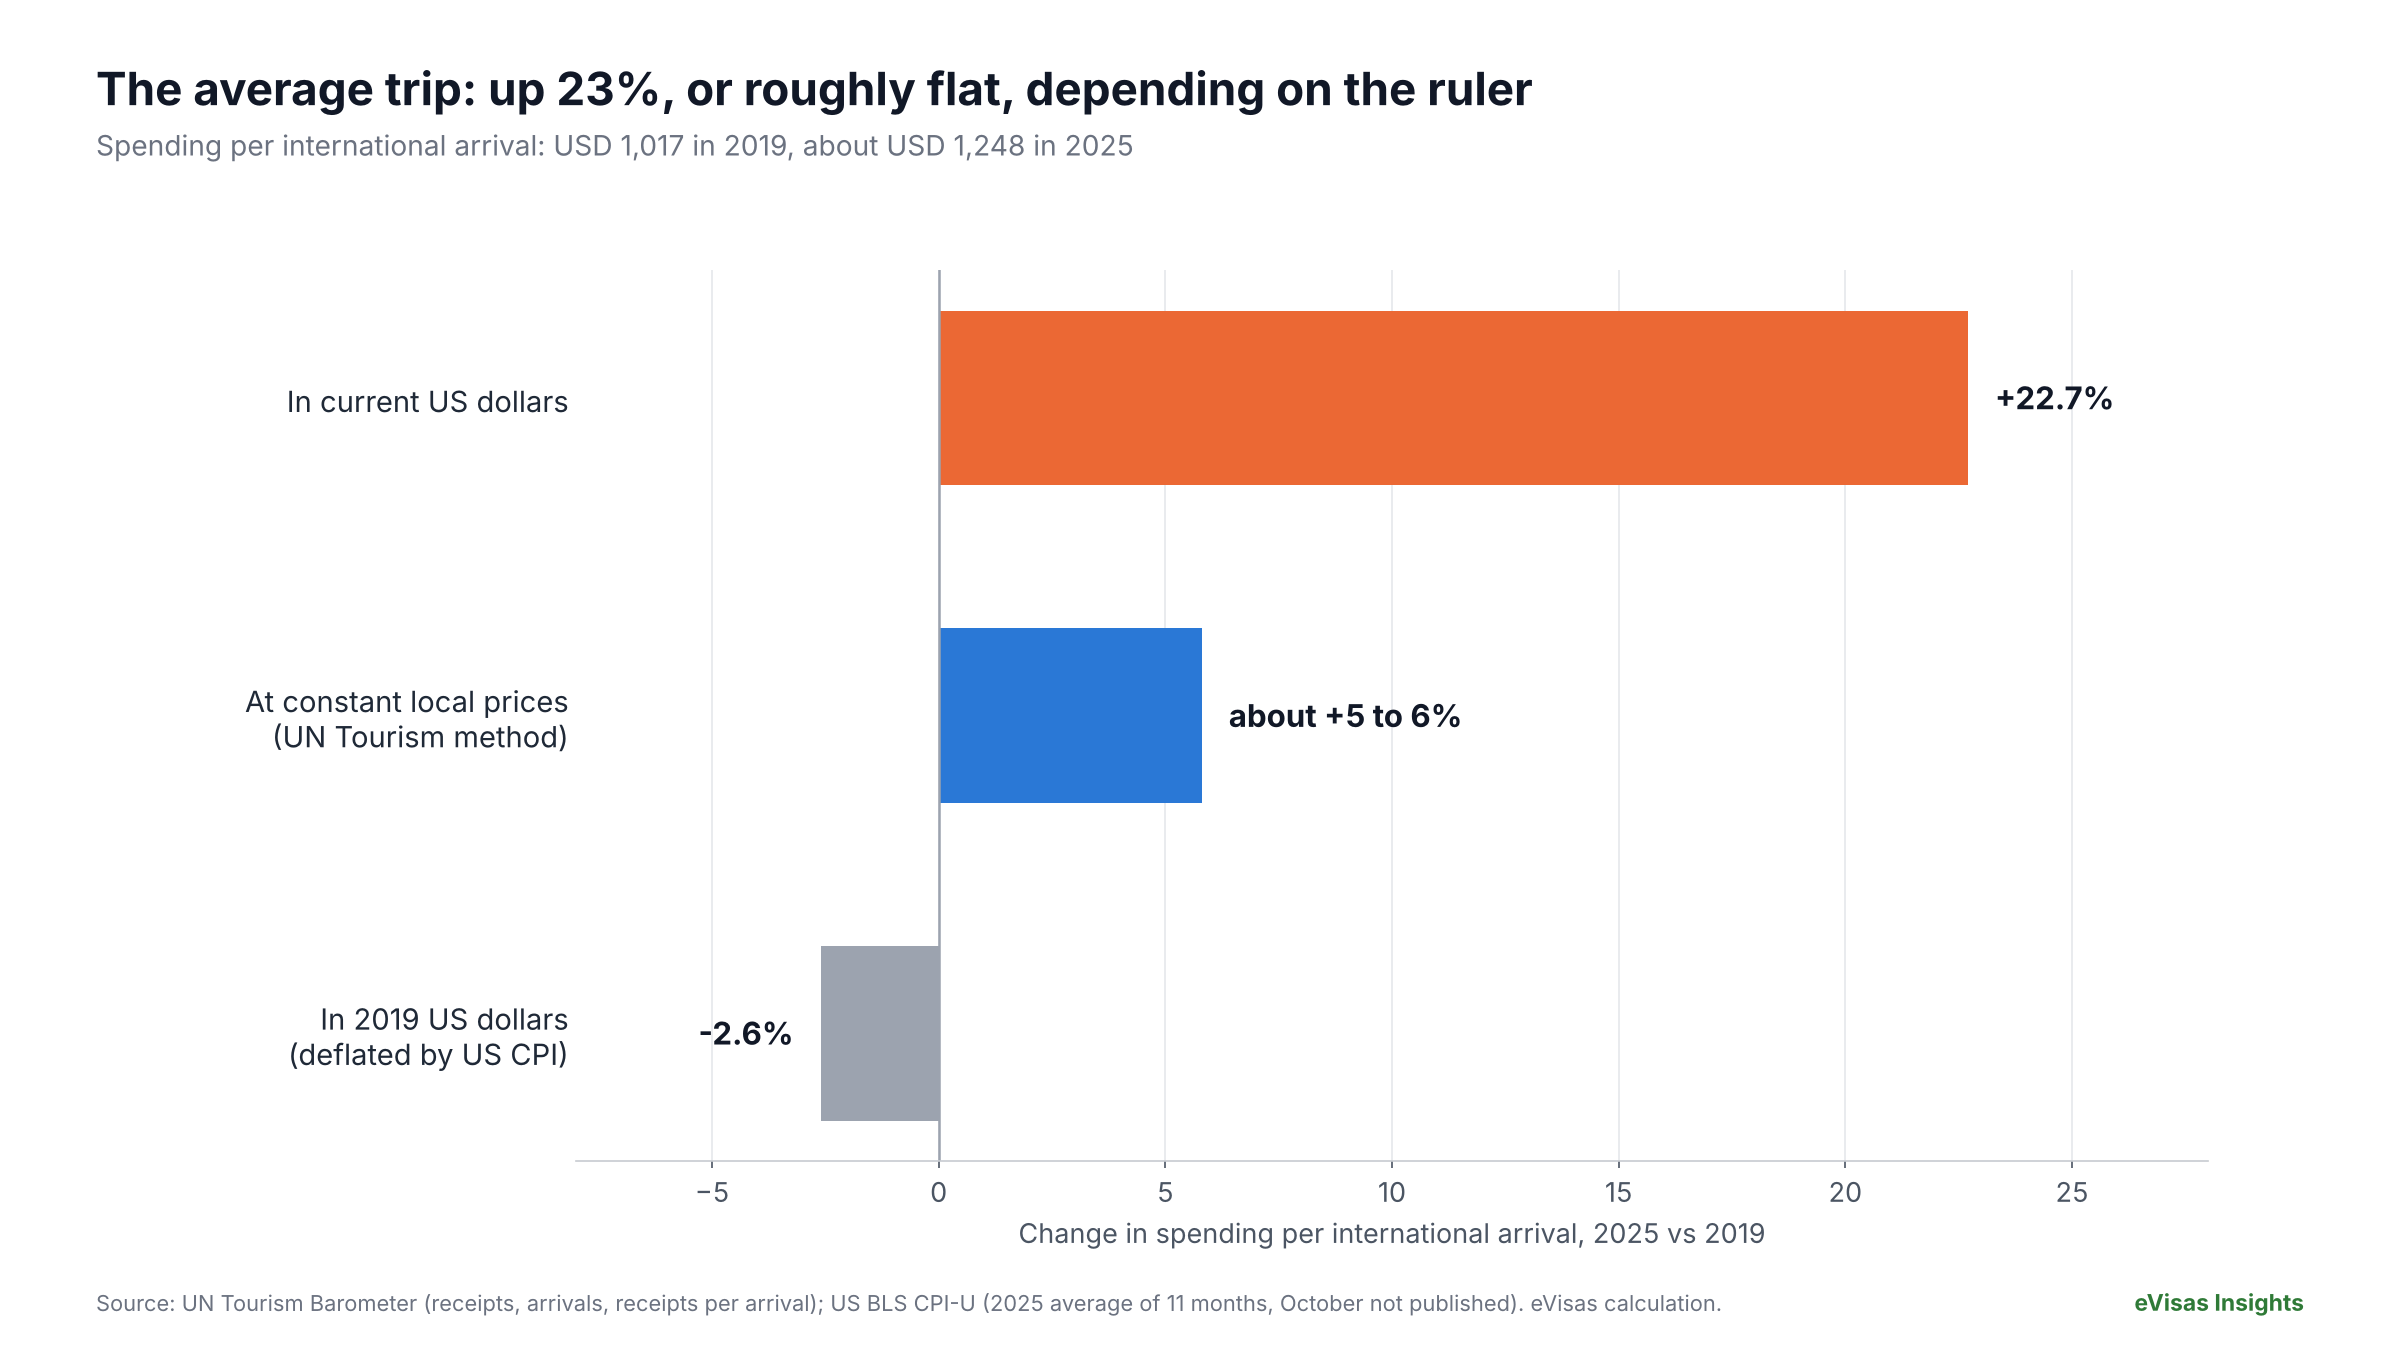
Chart 2. Change in spending per international arrival, 2025 against 2019, measured three ways. Sources: UN Tourism World Tourism Barometer; US Bureau of Labor Statistics CPI-U; eVisas calculation.
In current US dollars: up 22.7%. UN Tourism’s January 2025 Barometer put receipts per arrival at USD 1,017 in 2019. Dividing the 2025 receipts estimate (USD 1.9 trillion) by 2025 arrivals (1,523 million) gives about USD 1,248. This is the number most headlines would use, and it is the least informative.
In 2019 US dollars: down 2.6%. The US consumer price index rose 25.9% between the 2019 average and the 2025 average. Deflating USD 1,248 by that amount leaves about USD 991, slightly below 2019. This ruler suits a reader who thinks in dollars, but it treats US inflation as if it applied everywhere, which it does not.
At constant local prices: up about 5 to 6%. UN Tourism reports that receipts in 2024 were 4% above 2019 in real terms and that 2025 receipts grew a further 5 to 6% in real terms. Chained together, real receipts in 2025 were about 9 to 10% above 2019. With arrivals 3.7% higher, real spending per arrival is up roughly 5 to 6%. This is the most defensible single answer, because it measures spending in the currency the traveller actually spent and removes local inflation.
UN Tourism reached a similar conclusion by a different route in January 2025, when it said average spending per arrival had eased from nearly USD 1,400 in 2020 and 2021 to about USD 1,100 in 2024, still above the pre-pandemic average of about USD 1,000 per trip in real terms.
The honest summary: the average international traveller is spending somewhat more in real terms than in 2019, but most of the rise in the dollar figures is inflation.
Country-level corroboration: Japan and France
The Japan Tourism Agency’s inbound consumption survey is one of the most detailed visitor-spending surveys in the world. In 2019, the average general visitor spent JPY 158,531. In 2025, the figure was JPY 228,782, according to the agency’s final 2025 results. Total inbound consumption reached a record JPY 9.45 trillion, up 16.4% on 2024.
That is a 44% rise in yen. But the yen fell sharply over the period: the Federal Reserve’s annual average rate went from 109.02 yen per dollar in 2019 to 149.57 in 2025, a 37% depreciation.
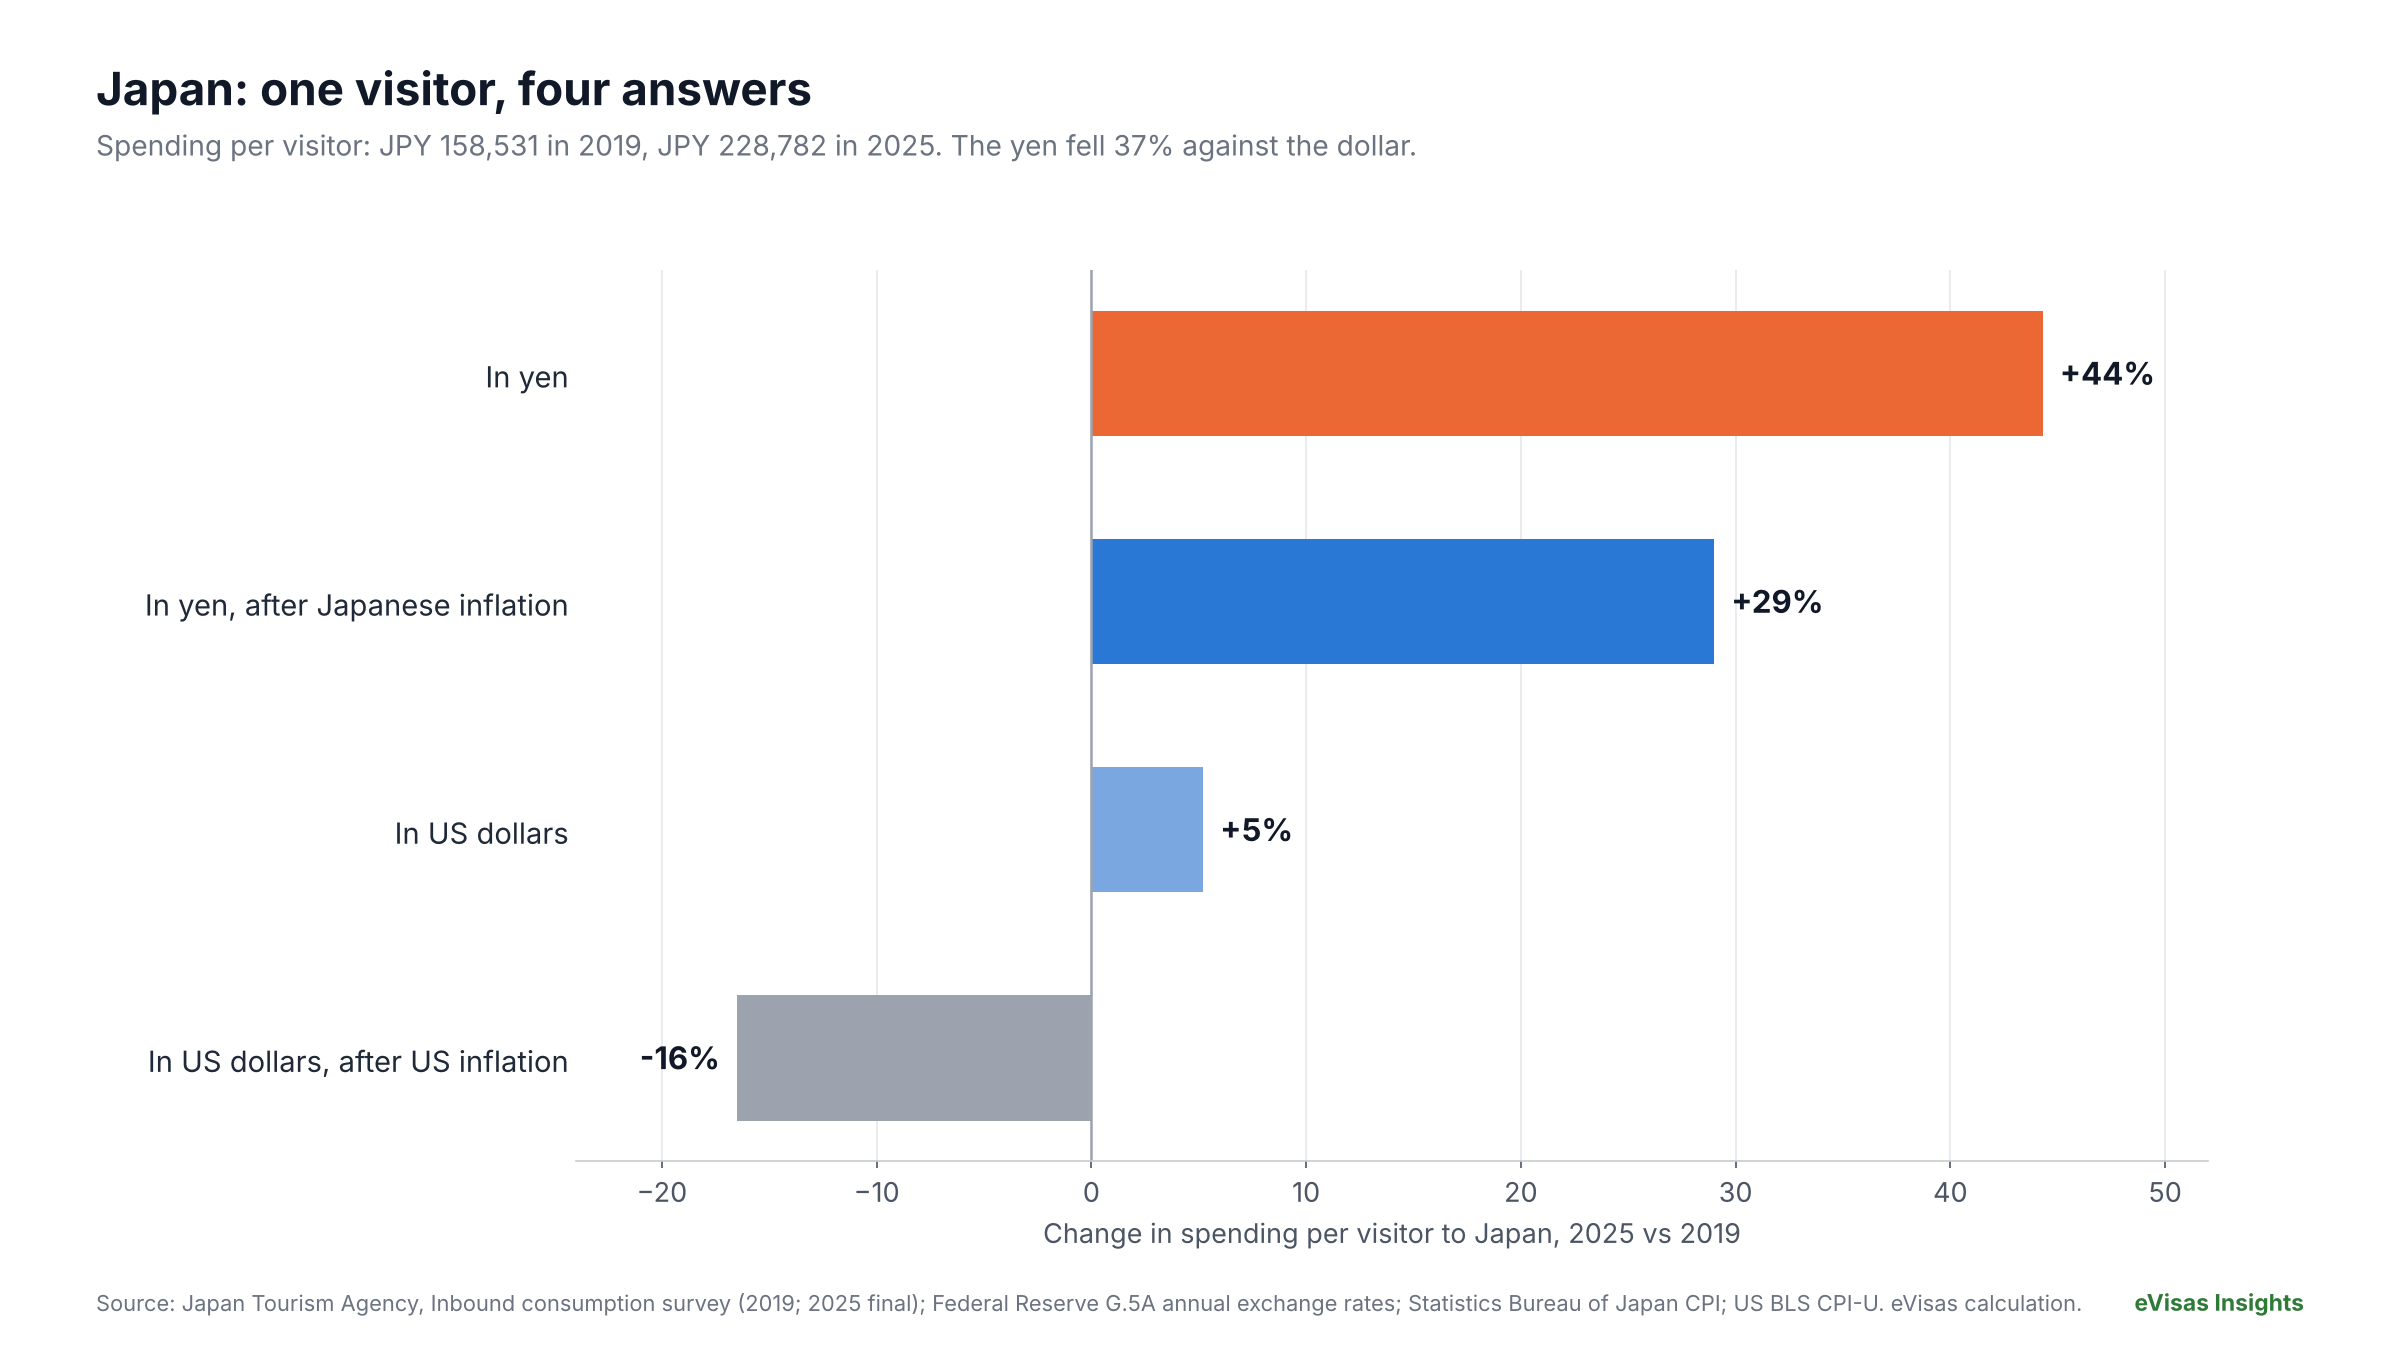
Chart 3. Change in spending per visitor to Japan, 2025 against 2019, in four measures. Sources: Japan Tourism Agency; Federal Reserve G.5A; Statistics Bureau of Japan; US BLS; eVisas calculation.
Measured four ways, the same visitor to Japan gives four answers:
1. In yen: up 44%.
2. In yen, after Japanese inflation: up about 29%. Japan’s consumer price index stood at 111.9 in 2025 on a 2020 base, and prices were essentially flat in 2020.
3. In US dollars: up 5%, from about USD 1,454 to about USD 1,530.
4. In US dollars, after US inflation: down about 16%.
For Japanese hotels, shops and restaurants, which take payment in yen, the visitor really is spending much more: about 29% more in real yen. For a visitor paying from dollars, the trip cost only 5% more in nominal terms, which means Japan became cheaper in real terms. Both are true. UN Tourism itself credited Japan’s strong 2024 growth partly to the weaker yen.
Japan also challenges the “staying less” half of the story. The same survey shows the average general visitor stayed 9.5 nights in 2025, half a night longer than in 2024. At least in Japan, visitors are staying longer and spending more.
France: more spent per stay, after inflation too
France’s Directorate General for Enterprises (DGE) reported 102 million international visitors in 2025 and international tourism receipts of EUR 77.5 billion, up 9% on 2024. Average spending per international stay was EUR 760, up 7%.
French consumer prices, measured by Eurostat’s harmonised index, rose only 0.9% between 2024 and 2025. So the 7% rise in spending per stay is about 6% in real terms. That is a genuine increase in what visitors buy, not a price effect. International visitors also spent 261.2 million nights in French commercial accommodation, up 7.5%, faster than the growth in visitors.
The DGE’s figures imply an average of about 7.3 nights per international visitor in 2025 (743 million nights across all accommodation types, divided by 102 million visitors). The DGE did not publish a comparable 2019 figure alongside its 2025 results, so we cannot trend France’s length of stay from the same release.
Are trips getting shorter? The length-of-stay derivation
No global agency publishes the average length of an international trip. The closest large, consistent dataset is Eurostat’s monthly survey of tourist accommodation, which counts both arrivals and nights for guests from abroad across hotels, holiday rentals and campsites in all 27 EU countries.
Dividing nights by arrivals gives nights per arrival, which is a reasonable proxy for length of stay in commercial accommodation.
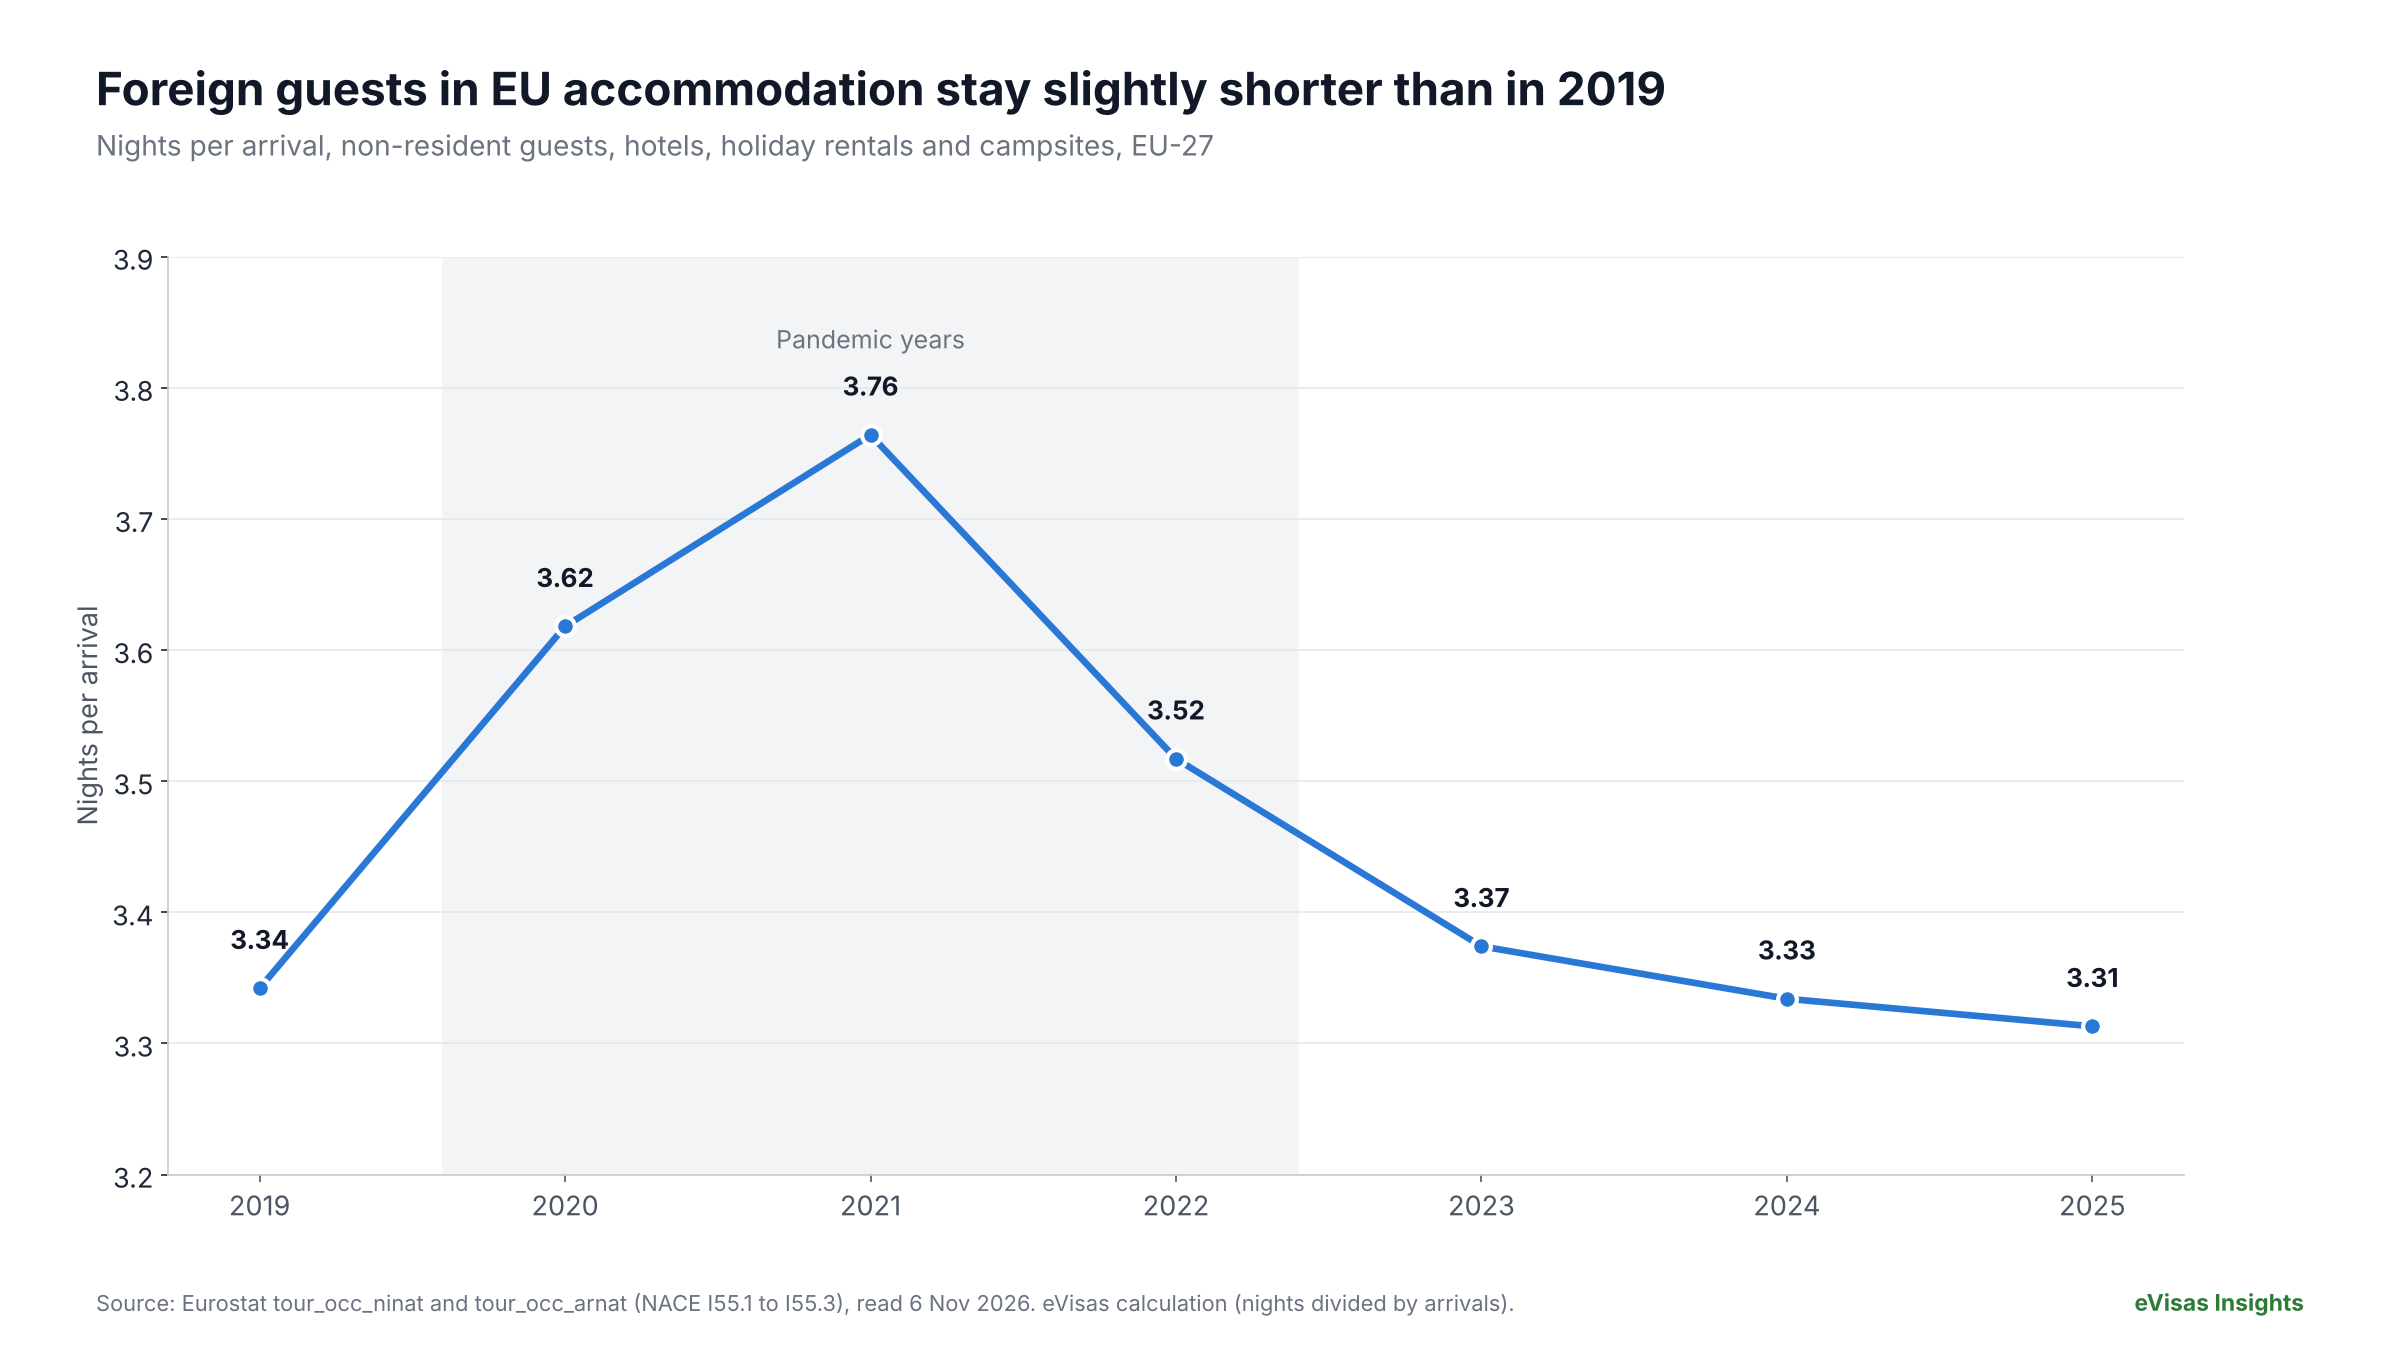
Chart 4. Nights per arrival for non-resident guests in EU-27 tourist accommodation, 2019 to 2025. Source: Eurostat tour_occ_ninat and tour_occ_arnat, read 6 November 2026; eVisas calculation.
The result:
Table 1. Non-resident guests in EU-27 tourist accommodation (NACE I55.1 to I55.3). Source: Eurostat, read 6 November 2026.
Three things stand out. First, stays lengthened during the pandemic, when fewer people travelled but those who did stayed longer. Second, since 2022 the figure has fallen every year. Third, by 2025 it had dropped below the 2019 level, to 3.31 nights.
The decline is small: 0.9% against 2019. Had foreign guests in 2025 stayed as long as in 2019, the EU would have recorded about 13 million more nights from foreign visitors. That is real money for accommodation businesses, but it is not a collapse in the holiday.
This measure counts a stay each time a guest checks in. A traveller who visits three hotels in a week registers three arrivals. A rise in multi-stop itineraries would therefore lower nights per arrival without shortening the trip itself. The derivation is indicative, not a direct measure of trip length.
Put the European and Japanese evidence together and the “staying less” part of the story needs care. Stays in EU accommodation are slightly shorter than in 2019. Stays in Japan, a long-haul destination for most visitors, grew longer in 2025. There is no single global trend in trip length that the data can confirm.
The currency and inflation trap
Most coverage of tourism receipts skips this section, and it is the one that decides whether the analysis holds up.
Dollar receipts move with the dollar. UN Tourism publishes world receipts in US dollars so that countries can be added together. When the dollar strengthens, a destination’s local-currency receipts translate into fewer dollars; when it weakens, into more. The euro, for instance, averaged USD 1.1194 in 2019 and USD 1.1306 in 2025, a 1% change, so European receipts were barely affected. The yen’s 37% fall had the opposite effect: Japan’s dollar receipts grew far more slowly than its yen receipts.
Local-currency receipts move with local inflation. A destination whose prices rise 20% will report 20% higher receipts from identical visitors. UN Tourism’s January 2026 Barometer noted that inflation in tourism-related services remained above its pre-pandemic average and above headline inflation, so this effect has been large.
The right ruler depends on the question.
1. To ask whether visitors are buying more, use constant local prices. On that basis, the answer is yes, by about 5 to 6% per arrival since 2019.
2. To ask whether a trip costs a dollar-based traveller more, use dollars deflated by US inflation. On that basis, the answer is no, by about 3%.
3. Never compare nominal dollar receipts across years and call the difference “spending more”.
Three cautions apply to the figures in this article. The 2025 world receipts number is UN Tourism’s rounded preliminary estimate of USD 1.9 trillion, so the per-arrival figure is approximate: a range of USD 1.85 to 1.95 trillion gives about USD 1,215 to 1,280. The 2025 US consumer price average excludes October 2025, which the Bureau of Labor Statistics did not publish because of the 2025 lapse in appropriations. And world receipts for earlier years are revised in later Barometers, so figures from different editions are not always exactly comparable.
The 2026 receipts outliers: real or currency?
UN Tourism’s May 2026 Barometer listed the destinations with the strongest receipts growth in the first quarter of 2026, compared with the first quarter of 2025. Three stood out: Pakistan (+60%), the Republic of Korea (+38%) and Mongolia (+27%). Morocco (+24%) and Brunei (+22%) followed.
UN Tourism reports destination receipts in local currencies where those are available, so these figures are not distorted by the dollar. They do include local inflation and, for an outbound-heavy market, any change in the currency’s value that makes the country cheaper for visitors.
The Republic of Korea is a good example. The won weakened from an average of 1,363 per dollar in 2024 to 1,421 in 2025, a 4% fall, according to the Federal Reserve. A weaker won makes Korea cheaper for foreign visitors and raises their won spending for the same dollar budget. UN Tourism had already listed Korea among the strongest receipts performers in 2025 (+18%), so the 2026 surge extends an existing trend rather than appearing from nowhere.
Quarterly growth rates from a single quarter also move sharply on small bases and on the timing of holidays and events. We treat these outliers as signals worth watching, not as proof of a lasting change in spending per visitor.
What it means for travellers and destinations
For travellers, the data says a trip abroad is not, on average, much more expensive in real terms than in 2019. It costs more in the currency of the day, because almost everything does. Where the traveller’s currency has strengthened, as the dollar did against the yen, some destinations have become cheaper in real terms. The cost of a trip depends heavily on the exchange rate between your currency and your destination’s.
For destinations, the encouraging news is the real growth in spending per visitor, about 5 to 6% worldwide and 6% in France in 2025 alone. The caution is that nominal records flatter the picture. A destination that celebrates record receipts without adjusting for inflation and currency may be counting price rises, not progress.
For accommodation businesses in Europe, slightly shorter stays mean more check-ins for the same number of nights. Each arrival carries fixed costs: cleaning, check-in and booking fees. A small drift toward shorter stays raises those costs per night sold even when total nights grow.
For anyone planning a longer trip, permitted stay length matters more than ever. A shorter typical stay does not mean every traveller wants less time. Our forthcoming article on long-stay destinations will compare how long each destination actually lets visitors stay, and on what conditions.
Methodology and limitations
Sources. World arrivals and receipts come from UN Tourism’s World Tourism Barometer (January 2025 and January 2026 editions, with the May and September 2026 editions for 2026 data). US inflation is the Bureau of Labor Statistics consumer price index for all urban consumers (CPI-U, US city average, not seasonally adjusted). Exchange rates are the Federal Reserve’s G.5A annual averages. Japanese spending and nights come from the Japan Tourism Agency’s inbound consumption survey; Japanese prices from the Statistics Bureau of Japan. French figures come from the DGE’s 2025 tourism review; French prices from Eurostat’s harmonised index of consumer prices. EU nights and arrivals come from Eurostat datasets tour_occ_ninat and tour_occ_arnat.
Calculations. Spending per arrival is receipts divided by arrivals. The 2025 figure uses UN Tourism’s rounded USD 1.9 trillion. The real-dollar figure deflates by the ratio of 2025 to 2019 CPI-U annual averages (the 2025 average uses the 11 published months). The constant-price figure chains UN Tourism’s reported real growth: +4% for 2024 against 2019, and +5% to +6% for 2025 against 2024. Nights per arrival is non-resident nights divided by non-resident arrivals in EU-27 accommodation (NACE I55.1 to I55.3).
Limitations. World receipts are preliminary and rounded, and revised in later editions. Arrivals count visitors at each border, so a multi-country trip appears several times, which lowers spending per arrival relative to spending per trip. Nights per arrival counts each check-in, so multi-stop itineraries lower it. Japan’s 2019 price level is taken as equal to 2020 because Japanese consumer prices were essentially flat in 2020. Every figure was read from the official source on 6 November 2026.
Dataset. The figures behind every chart are published with this article as a CSV file under a Creative Commons Attribution 4.0 licence.
Frequently asked questions
How much does the average international tourist spend?
About USD 1,250 per international arrival in 2025, according to UN Tourism’s estimate of USD 1.9 trillion in receipts from 1.52 billion arrivals. That excludes the international fare. In 2019 it was USD 1,017.
Are tourists spending more than before the pandemic?
In current dollars, yes: about 23% more per arrival than in 2019. After inflation, the gain is small. On UN Tourism’s constant-price basis it is about 5 to 6%, and in 2019 US dollars spending per arrival is about 3% lower.
Are holidays getting shorter?
In Europe, slightly. Foreign guests in EU accommodation averaged 3.31 nights per arrival in 2025, against 3.34 in 2019 (Eurostat). In Japan, stays grew longer in 2025, to an average of 9.5 nights. There is no confirmed global trend.
Why do tourism receipts grow faster than tourist arrivals?
Because each visitor spends more money, either because prices have risen, because the visitor buys more, or because of currency movements. Since 2019, inflation explains most of the gap.
What is the difference between tourism receipts and tourism export revenue?
Receipts are what international visitors spend inside the destination. Export revenue adds international passenger transport, such as fares paid to the destination’s airlines. In 2025 receipts were about USD 1.9 trillion and total export revenue about USD 2.2 trillion.
Do exchange rates affect tourism spending figures?
Yes, heavily. Spending per visitor to Japan rose 44% in yen between 2019 and 2025 but only 5% in US dollars, because the yen fell 37% against the dollar.
Conclusion
The average international traveller in 2025 was spending more money than in 2019, but not much more trip. Most of the rise in the dollar figures is inflation, with currency movements reshaping the picture country by country. Real spending per arrival is up about 5 to 6%, a solid gain but far short of what the nominal records suggest. And in Europe, at least, visitors are staying slightly less time in each place.
The lesson for anyone reading tourism statistics is to ask which ruler a number uses before drawing a conclusion. The lesson for travellers is that the length of your trip depends less on averages and more on the rules of the place you are going: how long it lets you stay, and on what terms.