The Tourism Data Blackout: Why the World's Most-Cited Travel Statistics Stopped in 2019
 Amina KhalidiAugust 23, 202634 min read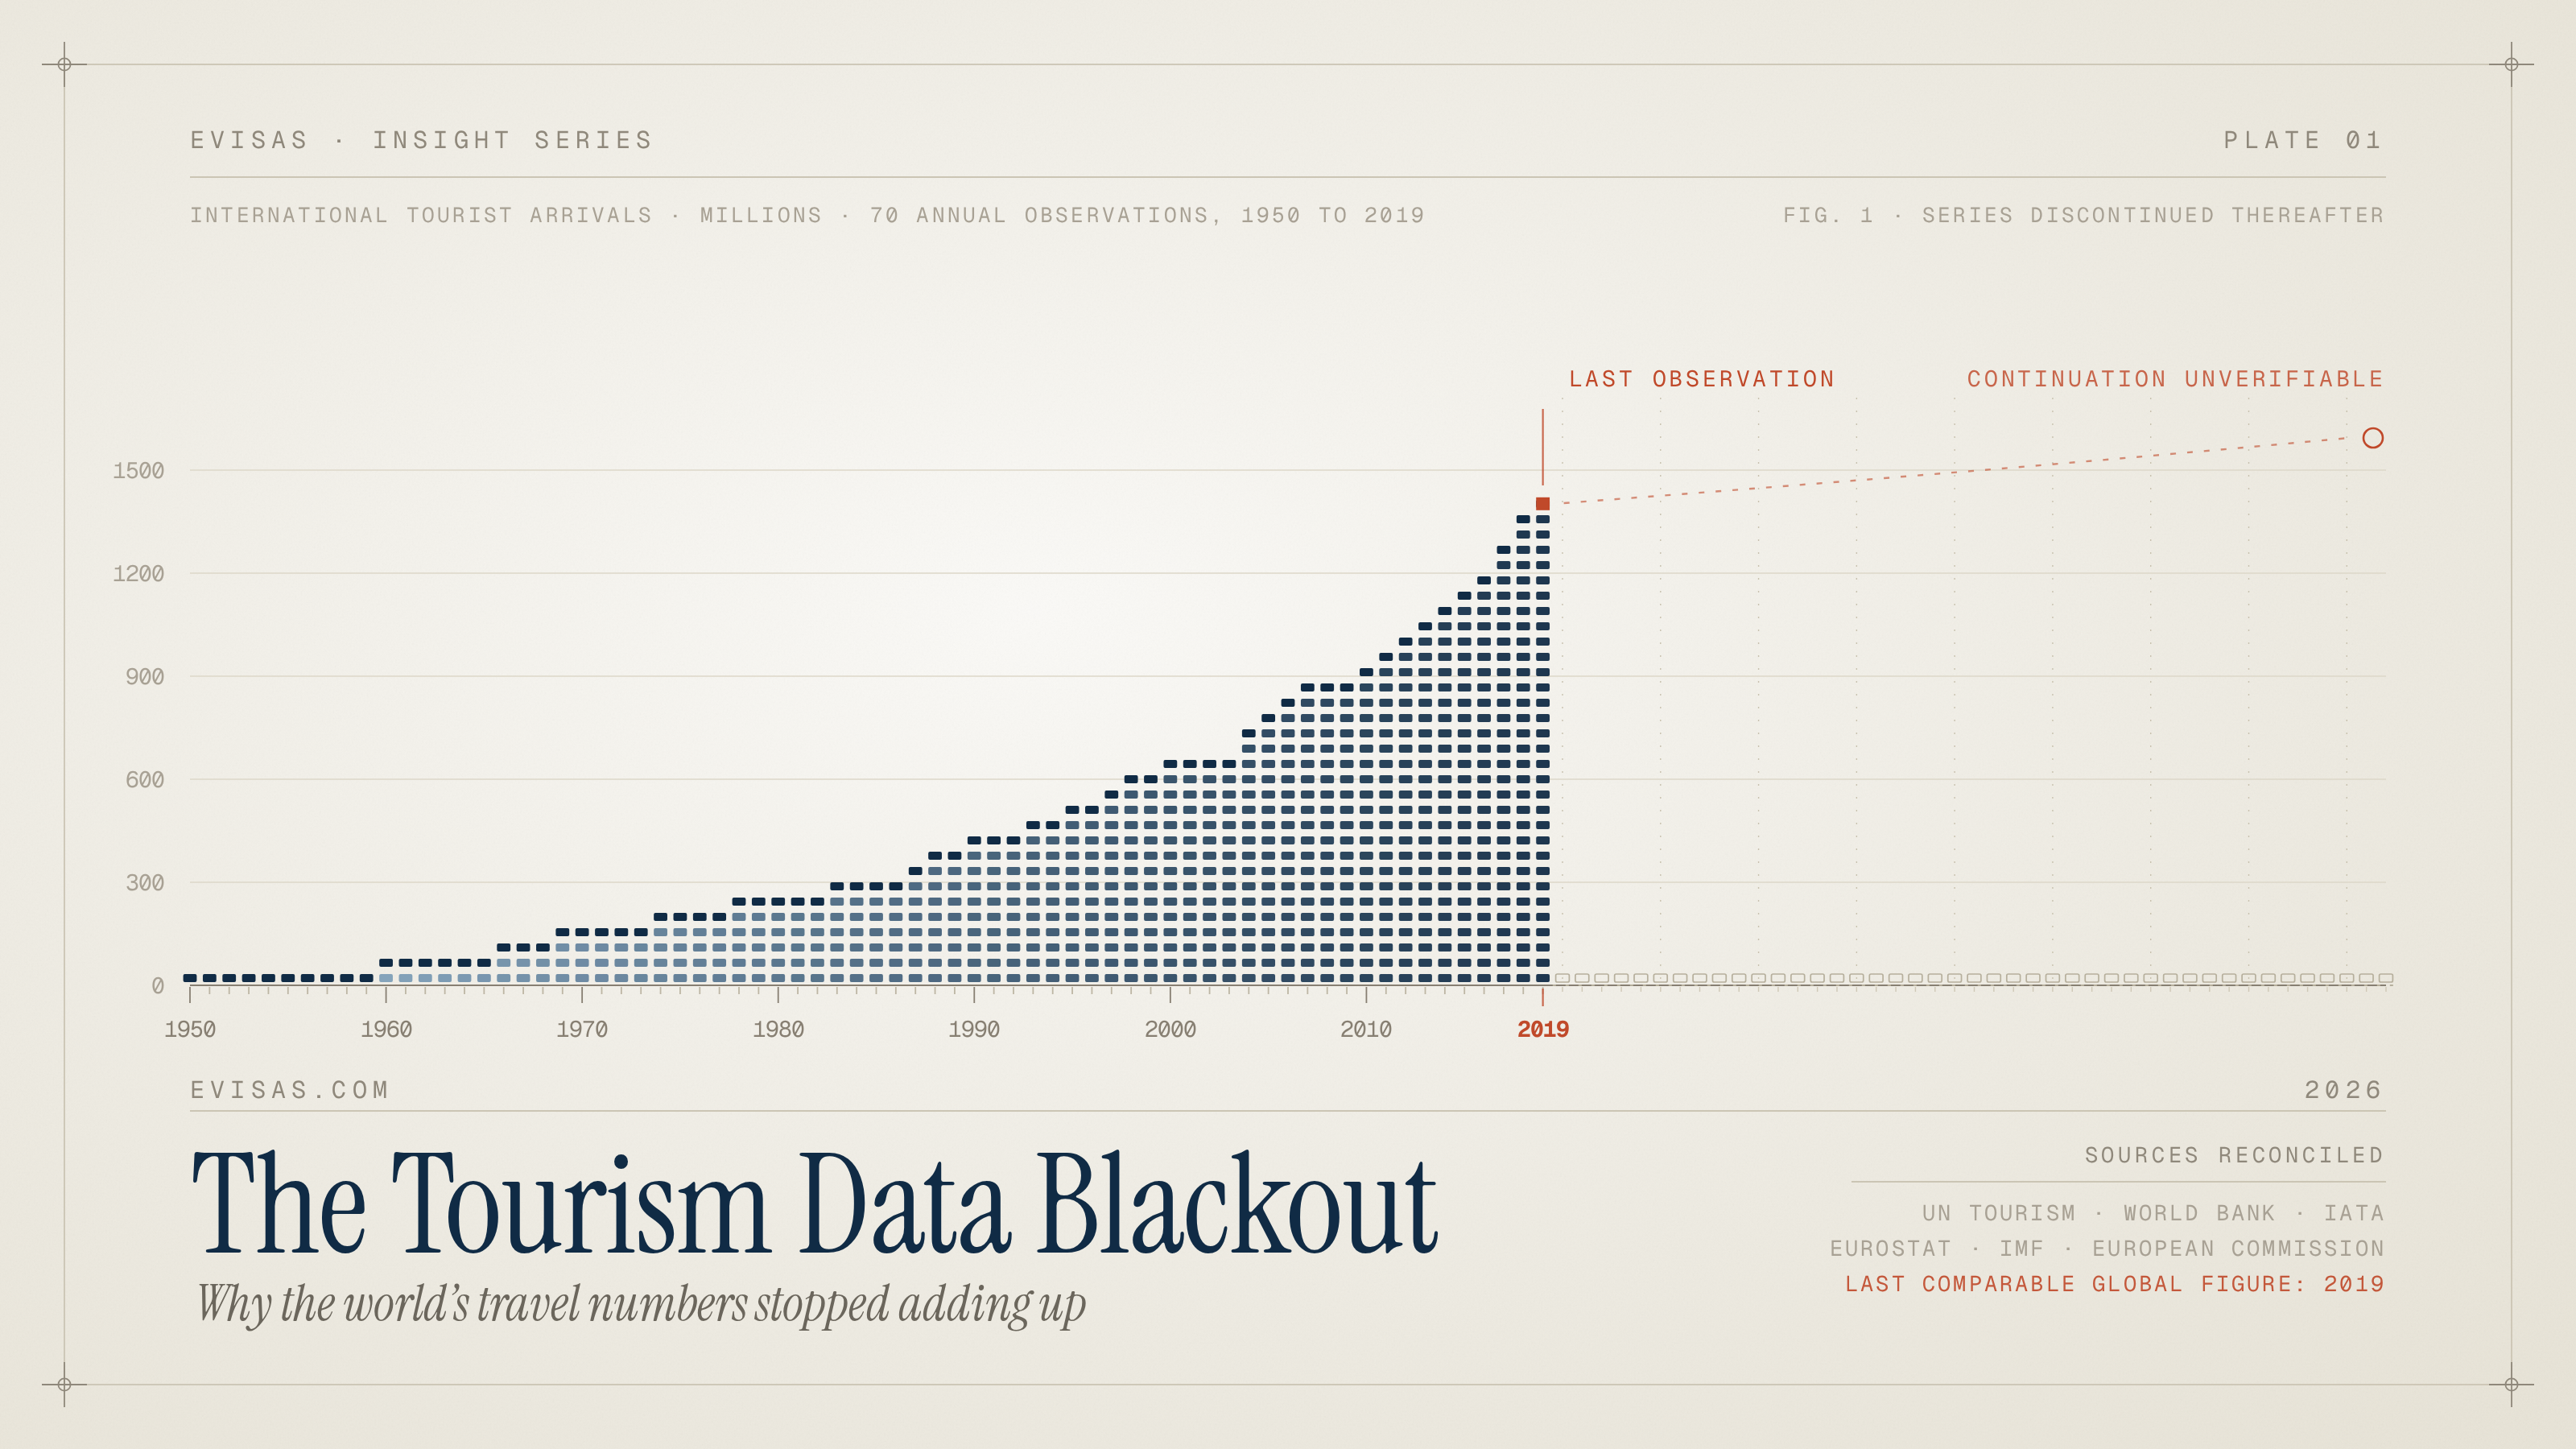
The World Bank's figure for international tourist arrivals worldwide is 2,403,074,088. It is precise down to a single traveller. It is free, it has an open API, it is licensed for reuse, and it sits at the top of the search results for anyone who needs a tourism number in a hurry.
It is also from 2019. We queried the World Bank's public data API on 18 August 2026, and every year from 2020 onward came back empty.
International travel is one of the largest industries on earth and one of the most heavily reported. It is also measured by a set of shared datasets that have quietly fallen out of date, contradict each other in ways that are rarely acknowledged, revise themselves without announcement, and leave at least one enormous question with no authoritative answer at all.
We audited the sources the industry runs on. Here is what is current, what is frozen, what it costs, what changes after you quote it, and what nobody is measuring.
The headline finding
The World Bank's headline tourism indicators have not been updated past 2019. It is not only arrivals. Its world figures for international tourism receipts, and for receipts as a share of total exports, stop in the same place. We queried all three series for every year from 2015 to 2024. All three return values through 2019 and nothing at all from 2020 onward.
The series was never backfilled through the disruption of the early 2020s, and five years on the gap remains.
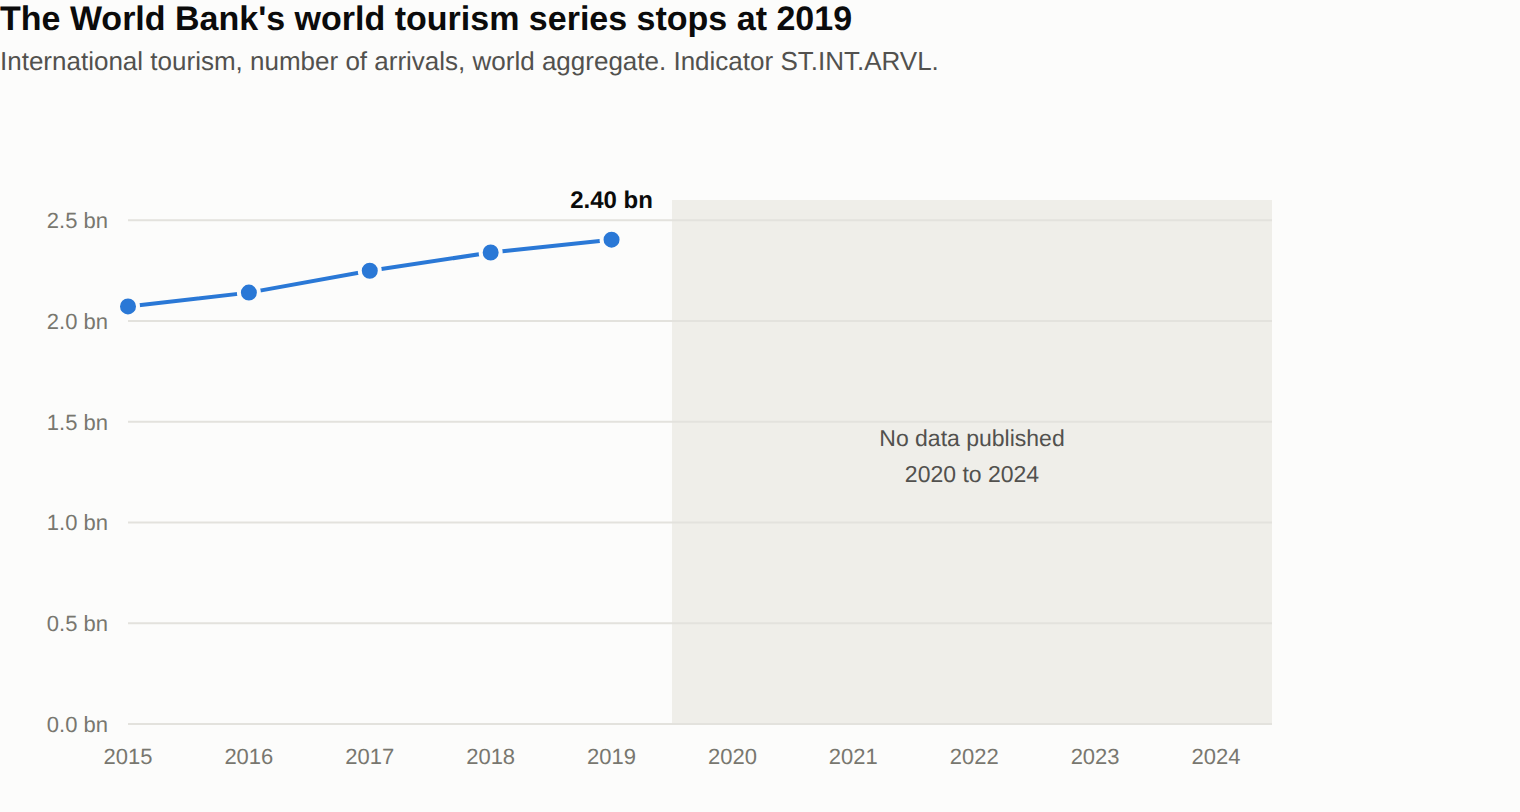
That matters more than a technical footnote suggests, because World Bank data is the default source for anyone who needs a tourism number in a hurry. It is free, it has an open API, it is licensed for reuse, and it sits at the top of search results. It is also, for this particular family of indicators, showing you the world as it was seven years ago.
Individual countries may carry more recent entries than the world aggregate does, so the finding is stated here for the world series specifically. That distinction matters, and it is the kind of distinction that gets lost the moment a figure is lifted out of its source and into a slide.
How far behind each source is
The World Bank is the extreme case, but it is not the only one. We measured the gap between the end of each source's latest published data period and today.
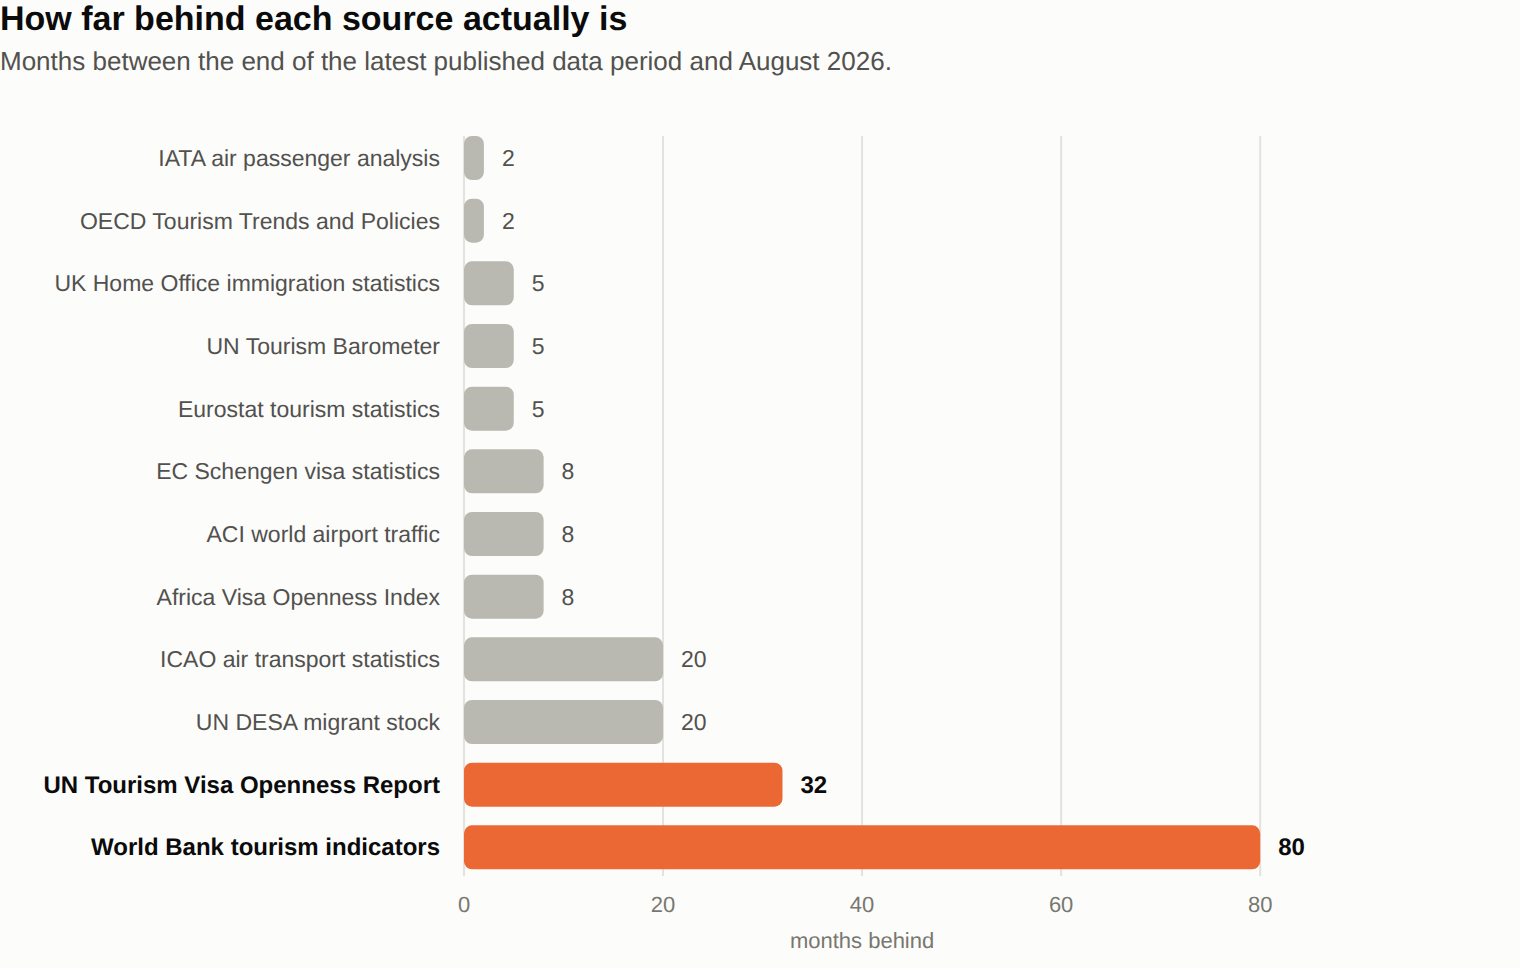
Most of the field is in reasonable shape. Eight of the twelve sources we checked are between two and eight months behind, which for international statistics is close to as good as it gets. IATA publishes monthly and its June 2026 analysis came out on 30 July 2026. UN Tourism, Eurostat and the UK Home Office are all five months behind.
Then there is a cliff. ICAO's air transport statistics and UN DESA's migrant stock are twenty months behind. UN Tourism's Visa Openness Report, the closest thing the world has to an official measure of how hard it is to cross a border, is thirty two months behind. And the World Bank's tourism series is eighty months behind, which is to say six years and eight months.
The ICAO case deserves a moment on its own, because it shows how a source can look current and not be. ICAO has published its Annual Report of the Council for 2025. What it has not published is the statistics that normally accompany it. The document that should contain the 2025 global passenger totals is a placeholder carrying a single line, in all six United Nations languages, saying that documentation will be posted as it becomes available. The most recent global passenger total ICAO has issued is for 2024: 4,669 million passengers carried on scheduled services, a figure ICAO itself labels preliminary.
What is actually current, and what it costs
The problem is that the stale sources and the current ones look identical from the outside. So does the free data and the data that costs thousands.
The access column is the one most people never look at, and it shapes what gets written about this industry more than anyone admits.
Consider the three most authoritative counts of air and airport traffic. ACI publishes its headline airport rankings free, and they are excellent. The underlying Annual World Airport Traffic Dataset, covering more than 2,800 airports across over 185 countries, is sold at five thousand US dollars for a non-member, or one thousand seven hundred and fifty for an airport member or business partner. IATA publishes its monthly analysis free and sells the detailed statistics behind it, and does not publish a price for any of them: the product pages direct you to contact sales. ICAO does the same with its data applications.
UN Tourism operates a different model again. The first six pages of each Barometer are free to everyone. The full document, and critically the statistical annex that carries country level arrival volumes, is available only to UN Tourism members and paying subscribers. That means the most basic question a travel writer can ask, which countries received the most international visitors last year and how many, has no free authoritative answer. We looked for one across three consecutive Barometer excerpts and it is not there.
The practical consequence is a distortion in what gets published. The free data gets quoted, the paid data does not, and the free data is not always the better data. A frozen 2019 series with an open API will out-circulate a current 2025 dataset behind a five thousand dollar licence every single time. Search engines and language models both amplify that effect, because they can only index what they can reach.
Eurostat is the honourable exception and deserves saying so plainly. Its tourism data is current, granular, documented, downloadable in bulk, available through a free API, and explicitly licensed for commercial reuse with attribution. Its own copyright notice describes European statistics as a public good to be provided free of charge irrespective of subsequent commercial use. That is what good looks like.
What the current data actually says
Read regionally, the recovery is not the uniform story it is usually described as. Four of the five world regions are above where they were in 2019. One is not.
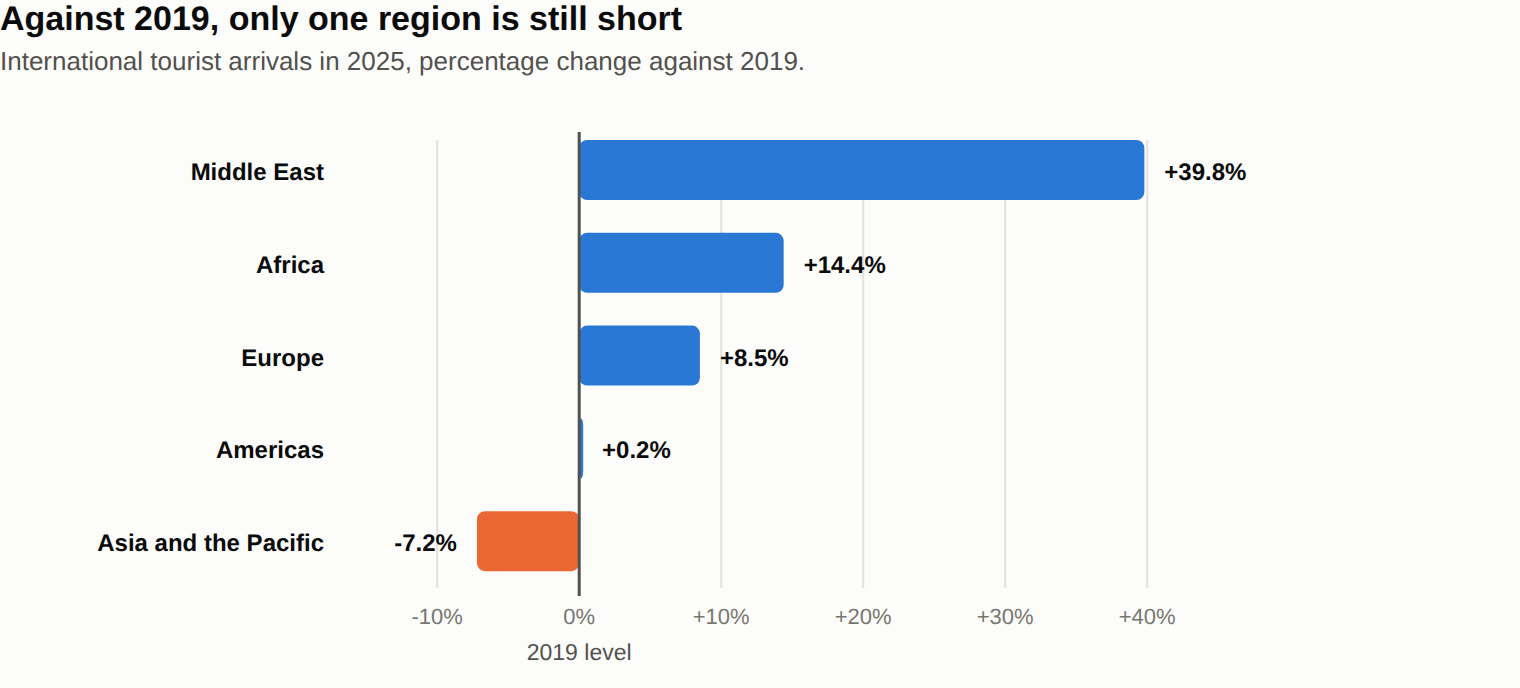
The world total for 2025 is 1,546 million international tourist arrivals, up 5.0 per cent on 2024 and 5.2 per cent above the 2019 level of 1,469 million.
The Middle East is 39.8 per cent above its 2019 level at 100.1 million arrivals, by some distance the strongest recovery of any region. Africa is 14.4 per cent above at 79.6 million. Europe, which receives more than half of the world's international arrivals at 809.6 million, is 8.5 per cent above. The Americas are almost exactly level with 2019, up 0.2 per cent at 219.7 million.
Asia and the Pacific, at 336.5 million arrivals, is 7.2 per cent below where it was in 2019. It is the only region still short, seven years on, and it is the reason the world total sits at 5 per cent rather than something larger.
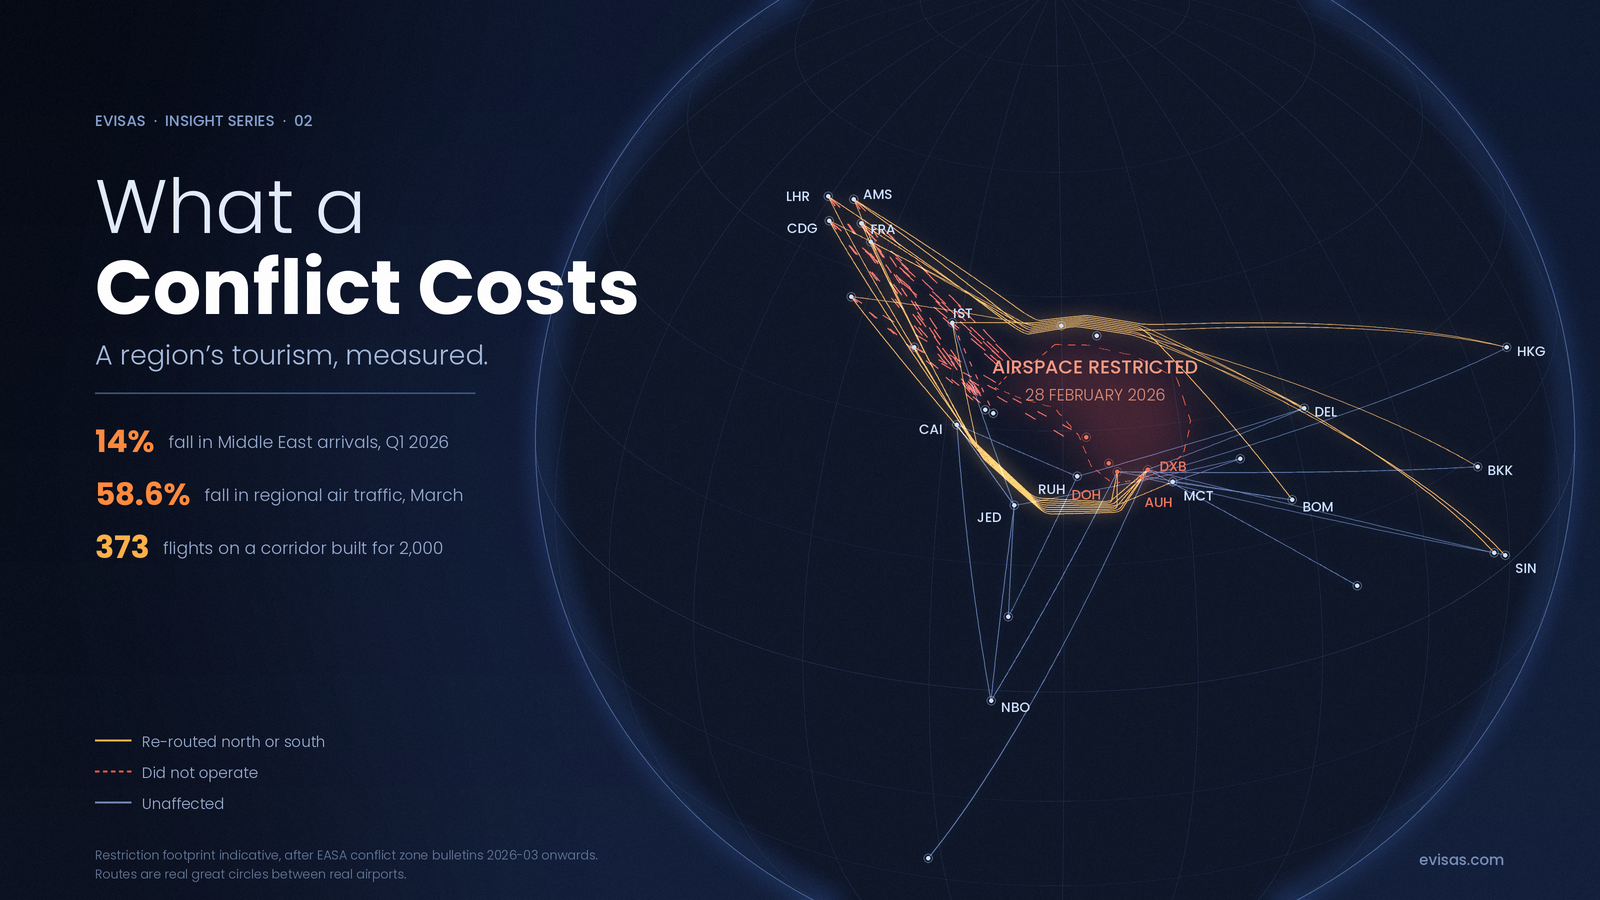
The most current picture, for the first quarter of 2026, is different again. UN Tourism estimates 307 million international tourists in the first three months of 2026, up 2 per cent on the same period in 2025. Europe and Africa each grew about 4 per cent, Asia and the Pacific about 3 per cent, the Americas about 2 per cent. The Middle East fell 14 per cent, which UN Tourism attributes in its own commentary to the conflict that began in the region at the end of February 2026. A region that was the growth story of 2025 became the drag on the first quarter of 2026, which is a useful reminder that any regional figure older than a few months is a description of conditions that may no longer hold.
The same year, restated
There is a second failure mode that catches even people who check the data year, and we walked into it ourselves while writing this article.
An earlier draft of this piece said that 2025 world arrivals were 1.52 billion, up 4 per cent on 2024. That was correct. It came from the January 2026 Barometer, quoted accurately, cited properly, with the data year checked.
It is now wrong. In its May 2026 edition, revised in July 2026, UN Tourism restated 2025 to 1,546 million and the growth rate to 5.0 per cent. That is 23 million arrivals and a full percentage point, added to a year that had already closed, by the same organisation, without a correction notice, because none was required. Both versions were labelled provisional at the time of publication. Both were the best available figure on the day they were published.
And 2025 was not the only year restated.
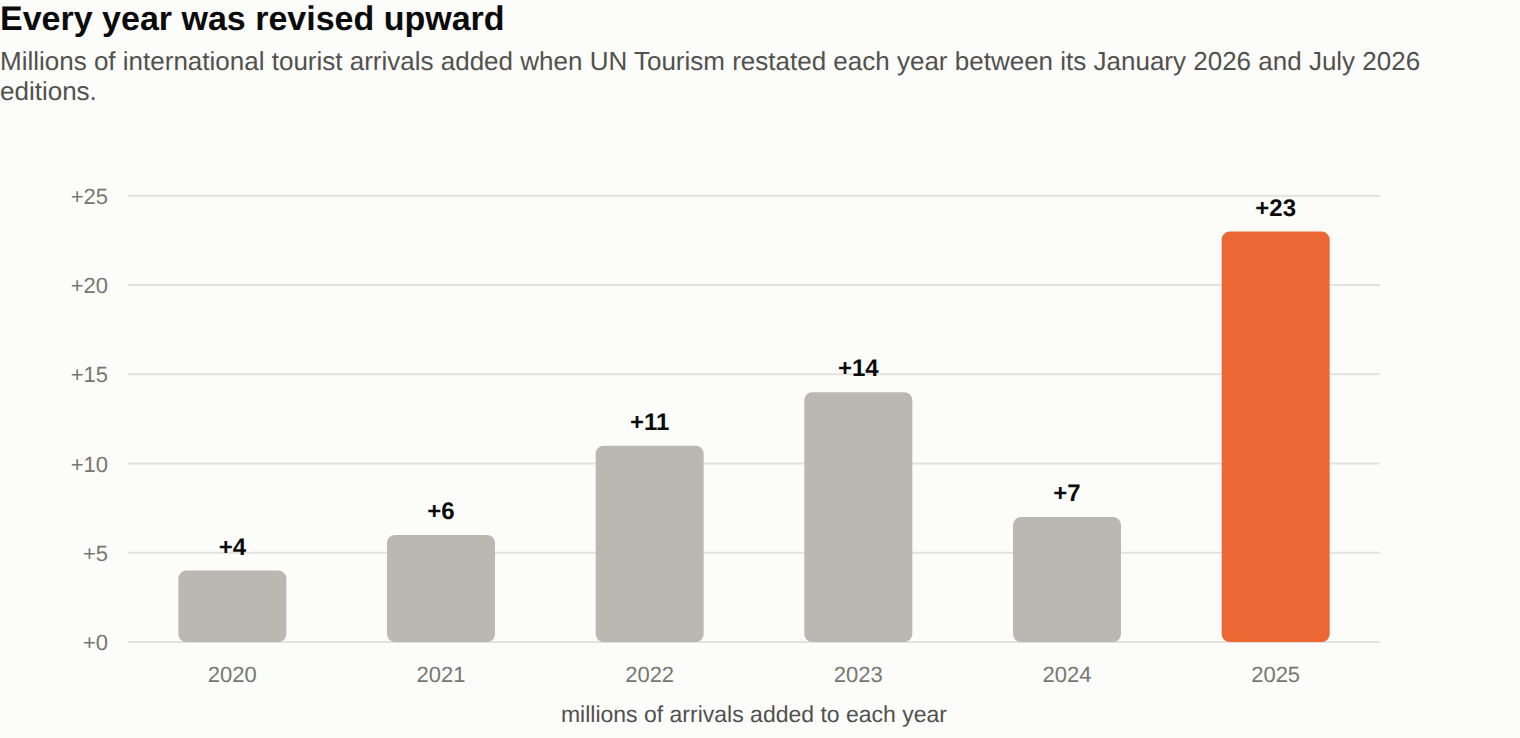
Every pandemic and post-pandemic year moved. 2020 gained 4 million, 2021 gained 6 million, 2022 gained 11 million, 2023 gained 14 million, 2024 gained 7 million, 2025 gained 23 million. Only 2019, the baseline against which everything else is measured, stayed put.
This is not a criticism of UN Tourism. Late reporting from national statistics offices is exactly why revisions exist, and an organisation that revises its figures as better data arrives is doing its job. The September 2026 edition is already billed as carrying more comprehensive results, which means another restatement is scheduled. The problem is entirely on the reader's side: a number quoted from a provisional series has a shelf life, and almost nobody who quotes one says which edition it came from.
It is not just UN Tourism. We found the same pattern in three other places while checking this article.
ACI restated the recovery. Its preliminary 2025 airport rankings, published in April 2026, put global passenger traffic 7.3 per cent above 2019. The final rankings, published in July 2026, put it 6.5 per cent above. The headline of 9.8 billion passengers did not move, but the recovery figure, which is the number most people actually quote, moved by nearly a percentage point.
Eurostat restated a record. In January 2026 it reported nearly 3.08 billion nights spent in EU tourist accommodation in 2025, up 2 per cent and 61.5 million nights more than 2024. In March 2026, working from complete monthly data rather than an estimate, it reported nearly 3.1 billion nights, up 2.2 per cent and 66.4 million more. The January article said openly that the annual total was estimated for the purpose of that publication. Very few of the write-ups that followed it did.
The UK restated a quarter, and published the comparison. The Office for National Statistics reported 10,493,000 overseas resident visits to Great Britain in the third quarter of 2024, then restated the same quarter to 10,408,000. Spend went from 10,244 million pounds to 10,153 million. Nights went from 90,830,000 to 90,360,000. To its considerable credit, ONS published both sets of figures side by side and explained exactly what had changed, which is more transparency than most bodies offer, and it warned that further revisions were likely while the estimates remain in development.
The trap that catches even careful writers
Here is the part that produces genuinely wrong journalism rather than merely dated journalism.
For 2019, the World Bank records 2,403,074,088 international arrivals worldwide. For the same year, UN Tourism records 1,469 million. The two organisations are not in dispute, and neither is wrong. They are counting different things.
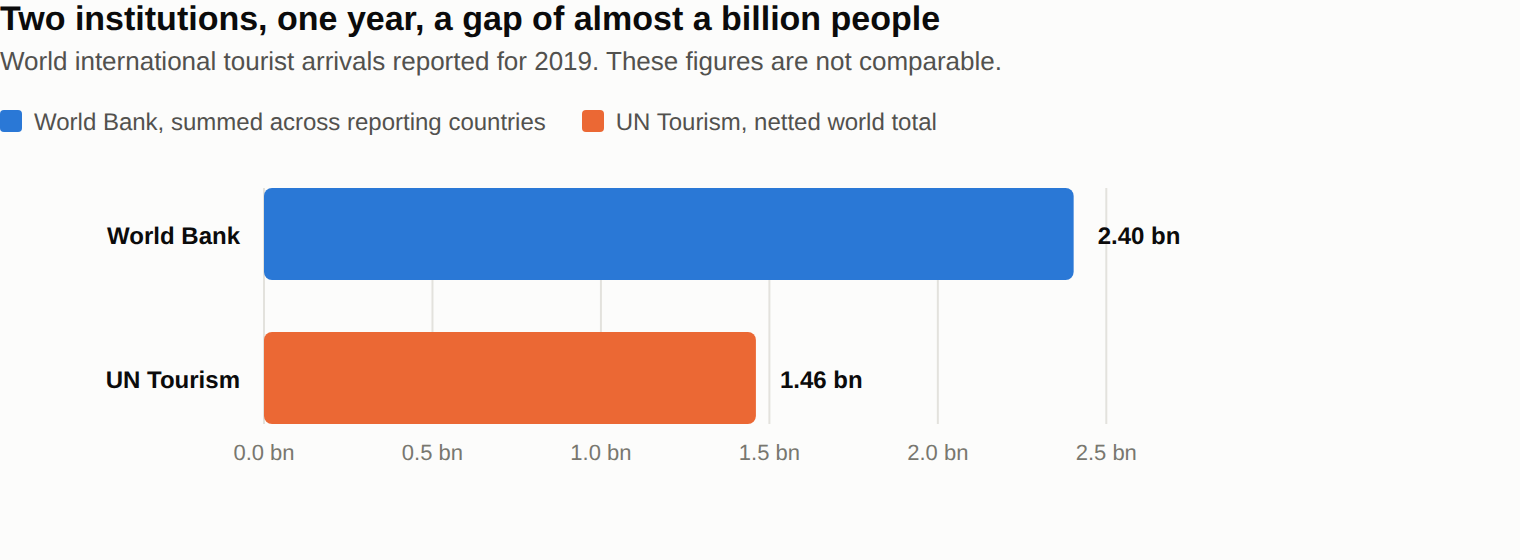
The World Bank indicator is built by adding up what each country reports. A traveller who visits three countries on one trip is counted three times, once by each destination. UN Tourism's global headline nets that down toward a single world total.
The consequence is simple and it is broken constantly. You cannot compare a World Bank world tourism total to a UN Tourism world tourism total. Doing so produces an apparent discrepancy of around a billion people, which then gets written up as a mystery, a data scandal, or a revision, when it is a definitional artefact and nothing more.
Four numbers about travel, none of them comparable
The same class of error runs through the rest of the field, and it gets worse the further you move from arrivals.
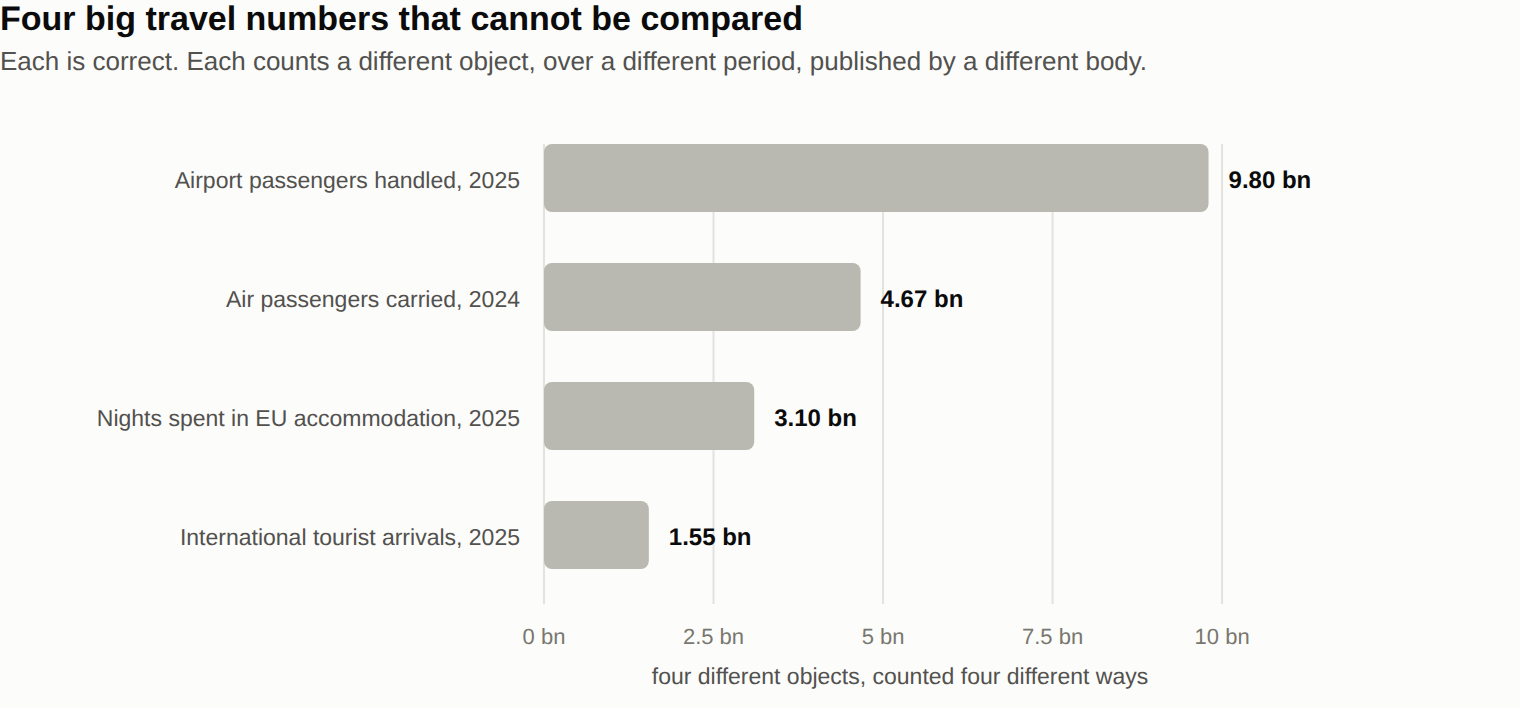
Each of these four numbers is correct. No two of them measure the same object.
9.8 billion is airport passengers handled worldwide in 2025, across 2,817 airports. One person flying from London to Singapore via Dubai is counted at least four times, on departure and arrival at each end and twice in transit.
4,669 million is passengers carried on scheduled air services in 2024, ICAO's measure. It counts flights, not people and not journeys, and it is a year older than the airport figure.
3.1 billion is nights spent in EU tourist accommodation in 2025. It counts nights, not visitors, and it covers 27 countries rather than the world. A single fortnight in Spain contributes fourteen.
1,546 million is international tourist arrivals worldwide in 2025. It counts arrivals, not people, and it excludes domestic travel entirely.
Every one of these has been used in print as a proxy for how many people travelled. None of them is that number. There is no such number, because "how many people travelled internationally last year" is not a quantity any of these systems is built to produce.
Several further traps sit underneath. Some countries count same day and cruise visitors in their arrivals figures and some do not. At least one major destination publishes a headline visitor number that combines domestic and international travel, which is entirely legitimate until somebody quotes it as an international figure. Tourism receipts are denominated in US dollars, which means a reported rise can partly reflect currency movement rather than real spending. None of this is hidden. It is all in the footnotes. It is simply that almost nobody reads the footnotes before quoting the number.
Where the entry data actually got better
It would be unfair to leave the impression that everything is deteriorating. One corner of this field has improved sharply, and it is the corner closest to what actually happens to a traveller at a border.
The European Commission publishes annual statistics on short-stay Schengen visas, broken down by the consulate where the application was lodged and by the Schengen state operating it. The 2025 data was published on 28 May 2026, and it is granular, free, and released as raw workbooks rather than a summary.
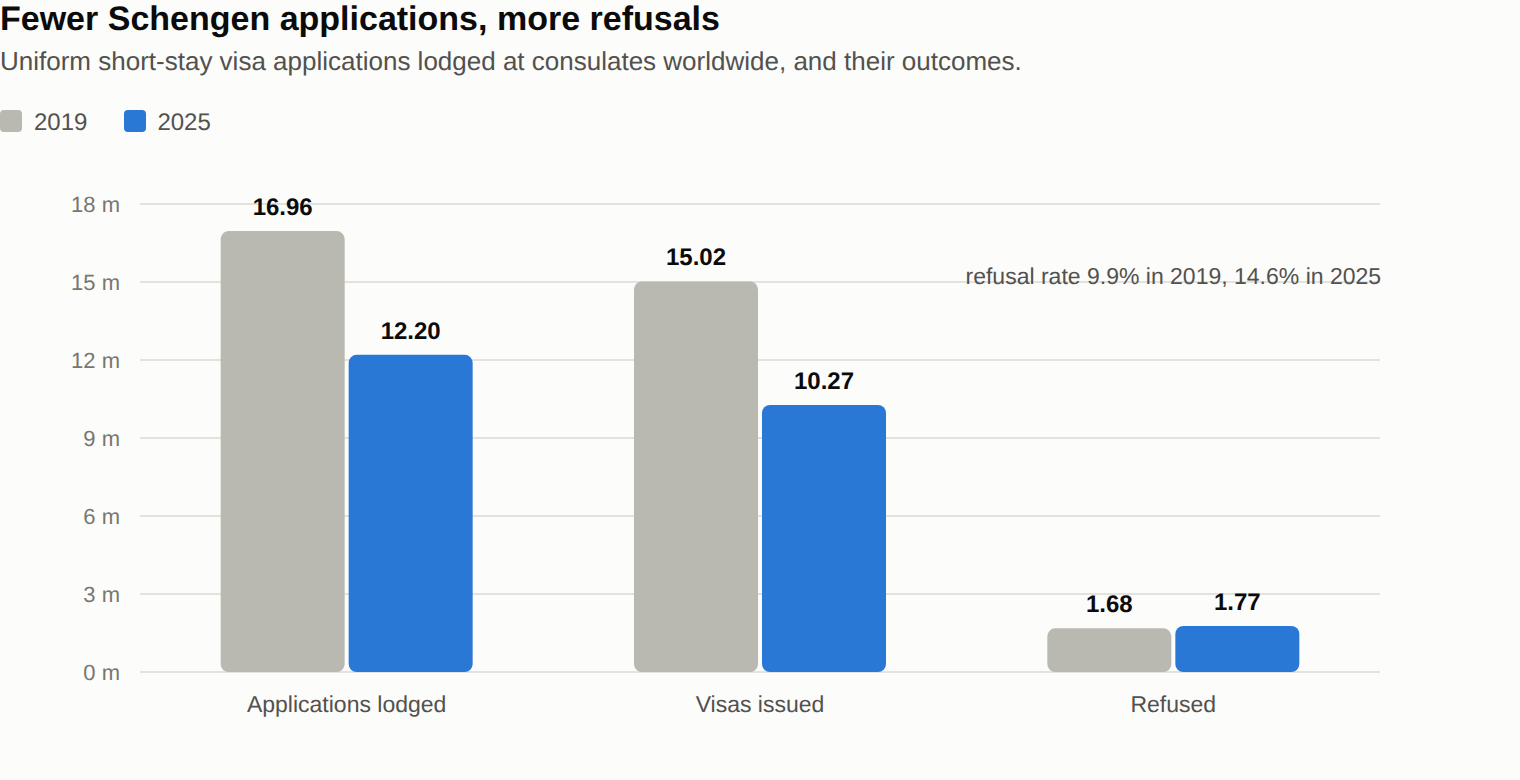
In 2025, consulates worldwide received 12,201,026 applications for uniform short-stay visas and issued 10,265,942 of them. In 2019 they received 16,955,541 and issued 15,022,255. So applications are still 28 per cent below where they were before the disruption of the early 2020s.
The refusal figures moved in the opposite direction. In absolute terms refusals barely changed, from 1,678,026 in 2019 to 1,768,605 in 2025. But because the pool of applications shrank, the refusal rate rose from 9.9 per cent to 14.6 per cent. Roughly one application in seven is now unsuccessful, against roughly one in ten before.
The composition changed too. In 2019 the largest single source of applications was the Russian Federation, with 4,133,100. In 2025 it was China, with 1,915,149, followed by Turkey with 1,268,376 and India with 1,153,748. On the receiving side France processed the most applications in both years.
The United Kingdom's numbers tell a parallel story about the shift from visas to digital authorisations. In the year ending March 2026, the Home Office granted 2,241,997 visitor visas from 2,773,212 applications, a grant rate of 79.3 per cent. Over the same period it reports 25.1 million Electronic Travel Authorisations granted. The authorisation, in other words, is now more than ten times the size of the visa route by volume, and it barely existed three years ago.
There is a caveat worth stating, because it illustrates a point this article keeps returning to. Within that single Home Office release, the visa tables are accredited official statistics and the ETA tables are not, and the ETA data carries an explicit note that everything up to the end of March 2026 is provisional. Two tables, one publication, different reliability. The distinction is stated plainly in the source and disappears the moment either figure is quoted.
On the European side, the Entry/Exit System started operating on 12 October 2025 and was fully deployed at all Schengen border crossing points on 10 April 2026. The Commission reported in its 2026 State of Schengen Report that more than 60 million entries and exits of third country nationals had been registered as of 20 April 2026. Its companion authorisation scheme, ETIAS, is not yet in operation; the most precise official statement we could find, from the Commission on 28 April 2026, is that it is scheduled to start in the last quarter of 2026 with the exact date to be communicated later in the year. Anything more specific than that, at the time of writing, is not coming from an official source.
Where reliability actually varies
Three further caveats are worth knowing before you cite anything in this field.
Current year figures are provisional, and the label is easy to miss. Every arrivals figure in the UN Tourism statistical table carries a provisional marker, including full year 2025. ICAO describes its 2024 results as preliminary and puts the likely margin of error on world totals at under 2 per cent, with financial data considerably worse. UN DESA issued its 2024 migrant stock figures as an advance unedited version. IATA states on every monthly release that all figures are provisional and historic data is subject to revision. Cite the issue and the date, not just the organisation.
Some national statistics are under reconstruction. The UK's Office for National Statistics changed how it measures inbound tourism from July 2024, moving to departure gate interviewing. It ran no parallel trial of the old and new methods, and it says so directly: estimates from before and after the change cannot be directly compared. That notice has since been superseded by an August 2025 update, which readers should check for the current position. Its outputs remain badged as official statistics in development, and its most recent
travel and tourism releases date from 2025. That is a credit to its transparency and a real
constraint on anyone using UK travel figures.
Spending figures deserve extra scepticism. In a July 2025 technical assistance report on external sector statistics, the International Monetary Fund recorded a material gap between one country’s tourism ministry figures for travel exports and the balance of payments estimate for the same year, with the tourism ministry figure the higher of the two. Receipts are also denominated in US dollars, so any cross-year comparison that has not been adjusted for exchange rates is telling you less than it appears to.
What nobody is measuring at all
The audit turned up one absence that is larger than any of the gaps above.
No institution anywhere publishes an authoritative count of how many countries issue visas online.
We looked at IATA, which maintains the commercial database airlines use to check travel documents at check in. We looked at ICAO, the United Nations aviation agency, which is developing the technical standards for digital travel credentials. We looked at UN Tourism, whose visa openness work is the closest thing to an official measure and which last published in 2023. We looked at national governments, which publish their own rules but not a global tally.
None of them counts it.
Every figure in circulation for how many countries operate an eVisa traces back, when followed, to a travel blog or a visa company website citing another travel blog or visa company website. There is no methodology, no source list and no update schedule behind any of them.
The one body doing this properly does it for a single continent. The Africa Visa Openness Report, produced by the African Development Bank with the African Union Commission, reached its tenth edition in 2025. It covers all 54 African countries, documents its method, and reports that 31 of them now operate an eVisa system, up from 26 the year before, with new schemes launched in Djibouti, Equatorial Guinea, Mauritania, Namibia and Somalia. It also records that only two countries, Rwanda and The Gambia, are visa free for citizens of every other African country, and that visa on arrival provision fell to its lowest recorded share of intra-African travel scenarios in 2025 while the share requiring a visa in advance rose to 51.1 per cent.
Even there, the difficulty of this kind of counting shows. At the time of writing, one panel on the African Development Bank's own website states that 26 countries offer an eVisa while the 2025 report and the accompanying narrative state 31, with 26 identified as the 2024 figure. Two official pages from the same institution, two different numbers, no way for a reader to know which is current without opening the report. If a well-resourced development bank with a documented methodology can end up with two live figures on its own site, the difficulty of doing this globally is not a small one.
And the absence is a strange one, because the underlying shift is one of the most consequential changes in international travel of the past fifteen years. It has reshaped who can travel where, how far in advance they must plan, and what a border actually is. The United Kingdom alone granted 25.1 million electronic travel authorisations in the year to March 2026. The European Union's biometric entry and exit system became fully operational in April 2026 and has already registered more than 60 million crossings. Thirty one of Africa's 54 countries now offer an eVisa.
And yet if you want to know how many countries have made the switch worldwide, there is no answer you can cite.
How to cite a travel statistic without getting caught
Everything above reduces to a short checklist. It takes about ninety seconds per figure and it will keep you out of almost all of this.
If a statistic seems surprising, the most likely explanation is not that something remarkable happened. It is that two sources are measuring different things, or that you are looking at an older edition than you think.
What we are doing about it
We are building the count.
In January 2027 we will publish the Global Digital Visa Index: a classification of every destination in the world by its entry system, built from primary government sources, with a documented methodology, a per country source and verification date, and a downloadable dataset published under a licence that permits reuse with attribution.
Free, in other words, and structured so that it can be quoted, checked and argued with. Given what this audit found about what happens to data that sits behind a licence, that is a deliberate decision rather than a generous one.
We are doing it because we work in this field every day and the absence is a daily problem, and because a reference nobody maintains is a reference somebody should build. We will publish the limitations alongside the findings, since classification in this area is genuinely difficult. A single country can operate several systems at once depending on the traveller's nationality, and any honest index has to say so. We will also date every entry, and we will keep the old versions visible when we revise, because after writing this article it would be difficult to do anything else.
If you work with this data and want to be told when it lands, or if you want to argue with the methodology before we finalise it, we would rather hear from you early than late.
Methodology and source notes
Every figure above was checked against its primary source in August 2026, and each source is named in the text. No figure in this article is an estimate produced by us.
The World Bank finding was established by querying the World Bank's open data API directly for the world aggregate on three indicators, covering international tourism arrivals, receipts in current US dollars, and receipts as a share of total exports, for every year from 2015 to 2024. The query was run on 18 August 2026. Every year from 2020 onward returned empty on all three. The last populated year for all three is 2019, at 2,403,074,088 arrivals, 1.86 trillion US dollars in receipts, and 7.39 per cent of total exports.
The lag chart is our own analysis. Lag is measured from the end of each source's latest published data period to August 2026, not from its publication date, because a report published this month about 2019 is still a report about 2019. Analytical publications that do not carry a data period are measured from publication instead, which flatters them slightly.
The revision chart compares the arrivals table printed in the January 2026 Barometer with the same table printed in the May 2026 Barometer as revised in July 2026. Both are the free excerpt, both are public documents, and both label the figures provisional.
Regional and world arrival figures are taken from the May 2026 Barometer as revised July 2026, as printed. Schengen visa figures are taken from the European Commission's published workbooks rather than from its press release, because the release rounds and the workbooks do not. UK figures are taken from the Home Office data tables, and where the Home Office publishes only a rounded narrative total, that is what is quoted here.
Where a publisher labels a figure provisional, preliminary, estimated, unedited or in development, that label is reported in the text. Where a publisher gives no publication date, we say so rather than inferring one.
Individual countries may carry more recent entries in the World Bank series than the world aggregate, so that finding is stated for the world series specifically.
Frequently asked questions
How many international tourists were there in 2025?
1,546 million, according to UN Tourism's May 2026 Barometer as revised in July 2026. That is up 5.0 per cent on 2024 and 5.2 per cent above the 2019 level of 1,469 million. Note that the January 2026 edition of the same publication put the figure at 1,523 million and growth at 4 per cent. Both were provisional. Quote the edition, not just the organisation.
Which region has recovered least since 2019?
Asia and the Pacific, which recorded 336.5 million arrivals in 2025, 7.2 per cent below its 2019 level. It is the only world region still short.
Why do different sources give different world tourism totals?
Because they count differently. Country summed indicators count a traveller once per country visited, so a three country trip appears as three arrivals. Netted global totals do not. Always check which basis a figure uses before comparing it with another.
Is World Bank tourism data wrong?
No. It is accurate for the years it covers. The problem is that its world series for these indicators currently stops at 2019, and it is frequently quoted as though it were current.
Which source should I use for current tourism figures?
UN Tourism for global and regional arrivals and receipts, Eurostat for European detail, the European Commission for Schengen visa volumes, and the relevant national statistics office for any single country, since national data is usually the most timely and granular of all.
Why do published tourism figures change after the year has ended?
Because national statistics offices report late and international bodies publish a best available estimate in the meantime. UN Tourism revised every year from 2020 to 2025 upward between its January 2026 and July 2026 editions, adding 23 million arrivals to 2025 alone.
How much does travel data cost?
It varies enormously. Eurostat and the European Commission's visa statistics are free, including bulk download. UN Tourism's country level data requires membership or a subscription. ACI's full airport dataset is sold at five thousand US dollars for non-members. IATA and ICAO sell their detailed products without publishing prices at all.
How many countries have an eVisa?
Nobody knows, in the sense that no authoritative body publishes the number. For Africa the Africa Visa Openness Report puts it at 31 of 54 countries in its 2025 edition. There is no equivalent global count. We are building one and will publish it in January 2027.
Conclusion
The tourism industry is not short of data. It is short of data that is current, comparable, affordable and honestly labelled, and the gap between those four conditions is where most bad travel statistics come from.
The practical advice is unglamorous. Check the data year before you check the number. Check the edition, because the same year can carry two values. Check the basis before you compare two figures. Read the footnote about what counts as an arrival. And when a statistic seems surprising, the most likely explanation is not that something remarkable happened, but that two sources are measuring different things.
We apply that discipline to the entry requirement information on this site, because it is the same problem in a different form: a rule that was accurate last year and quoted as though it were accurate today. How we verify and date that information is set out on our sourcing page.
Sources, all checked August 2026. UN Tourism World Tourism Barometer, Volume 24 Issue 1
January 2026 and Volume 24 Issue 2 May 2026 as revised July 2026. World Bank Open Data,
World Development Indicators tourism series, queried via the public API on 18 August 2026.
Eurostat tourism statistics, full year 2025 and first quarter 2026 releases, and the Eurostat
copyright and data revision notices. European Commission Directorate General for Migration
and Home Affairs, statistics on short-stay visas issued by the Schengen States, 2025 and 2019.
European Commission 2026 State of Schengen Report. European Commission guidance on the
Entry/Exit System and ETIAS, April 2026. eu-LISA Entry/Exit System quarterly report, first
quarter 2026. UK Home Office immigration system statistics, year ending March 2026. UK
Office for National Statistics, Improving our travel and tourism statistics, February and June
2025 updates, and the July 2024 methodology change notice. OECD Tourism Trends and Policies
2026. UN Tourism Tourism Visa Openness Report 2023. African Development Bank and African
Union Africa Visa Openness Report 2025. UN DESA International Migrant Stock 2024. ICAO
annual air transport statistical results 2024 and Air Traffic Monitor. Airports Council
International world airport traffic, preliminary April 2026 and final July 2026. IATA air
passenger market analysis, June 2026. International Monetary Fund commentary on tourism
spending data, July 2025.